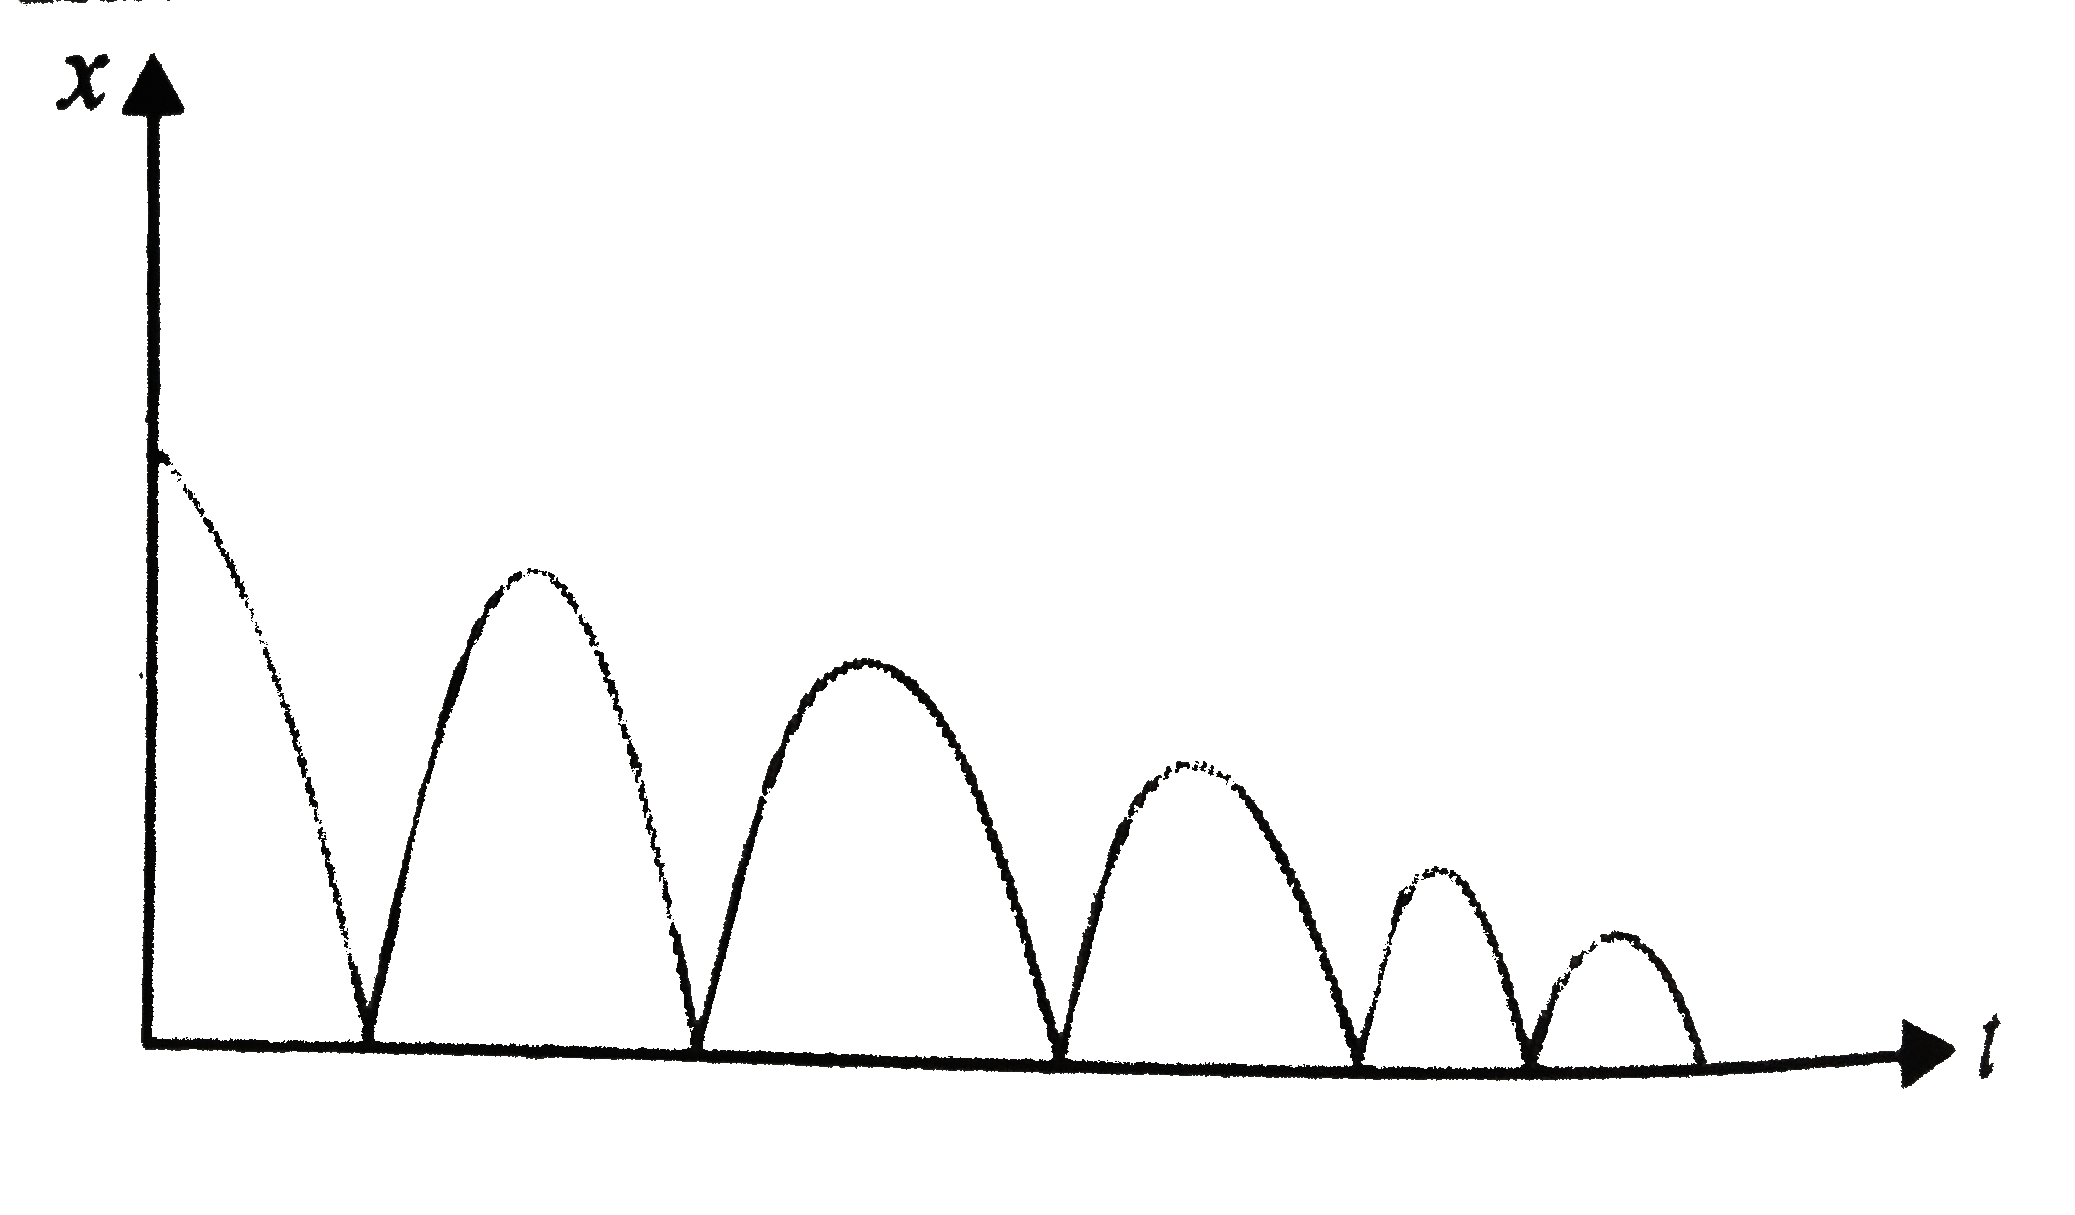
A ball is dropped and its displacement vs time graph is as shown in Fig. 2 (EP) .7 (displacement (x) is grom ground and all quantities are +ve upwards). (a) Plot qualitvely velocity vs time graph). (b) plot qualitatively acceleration vs time graph .
Video Solution
Text Solution
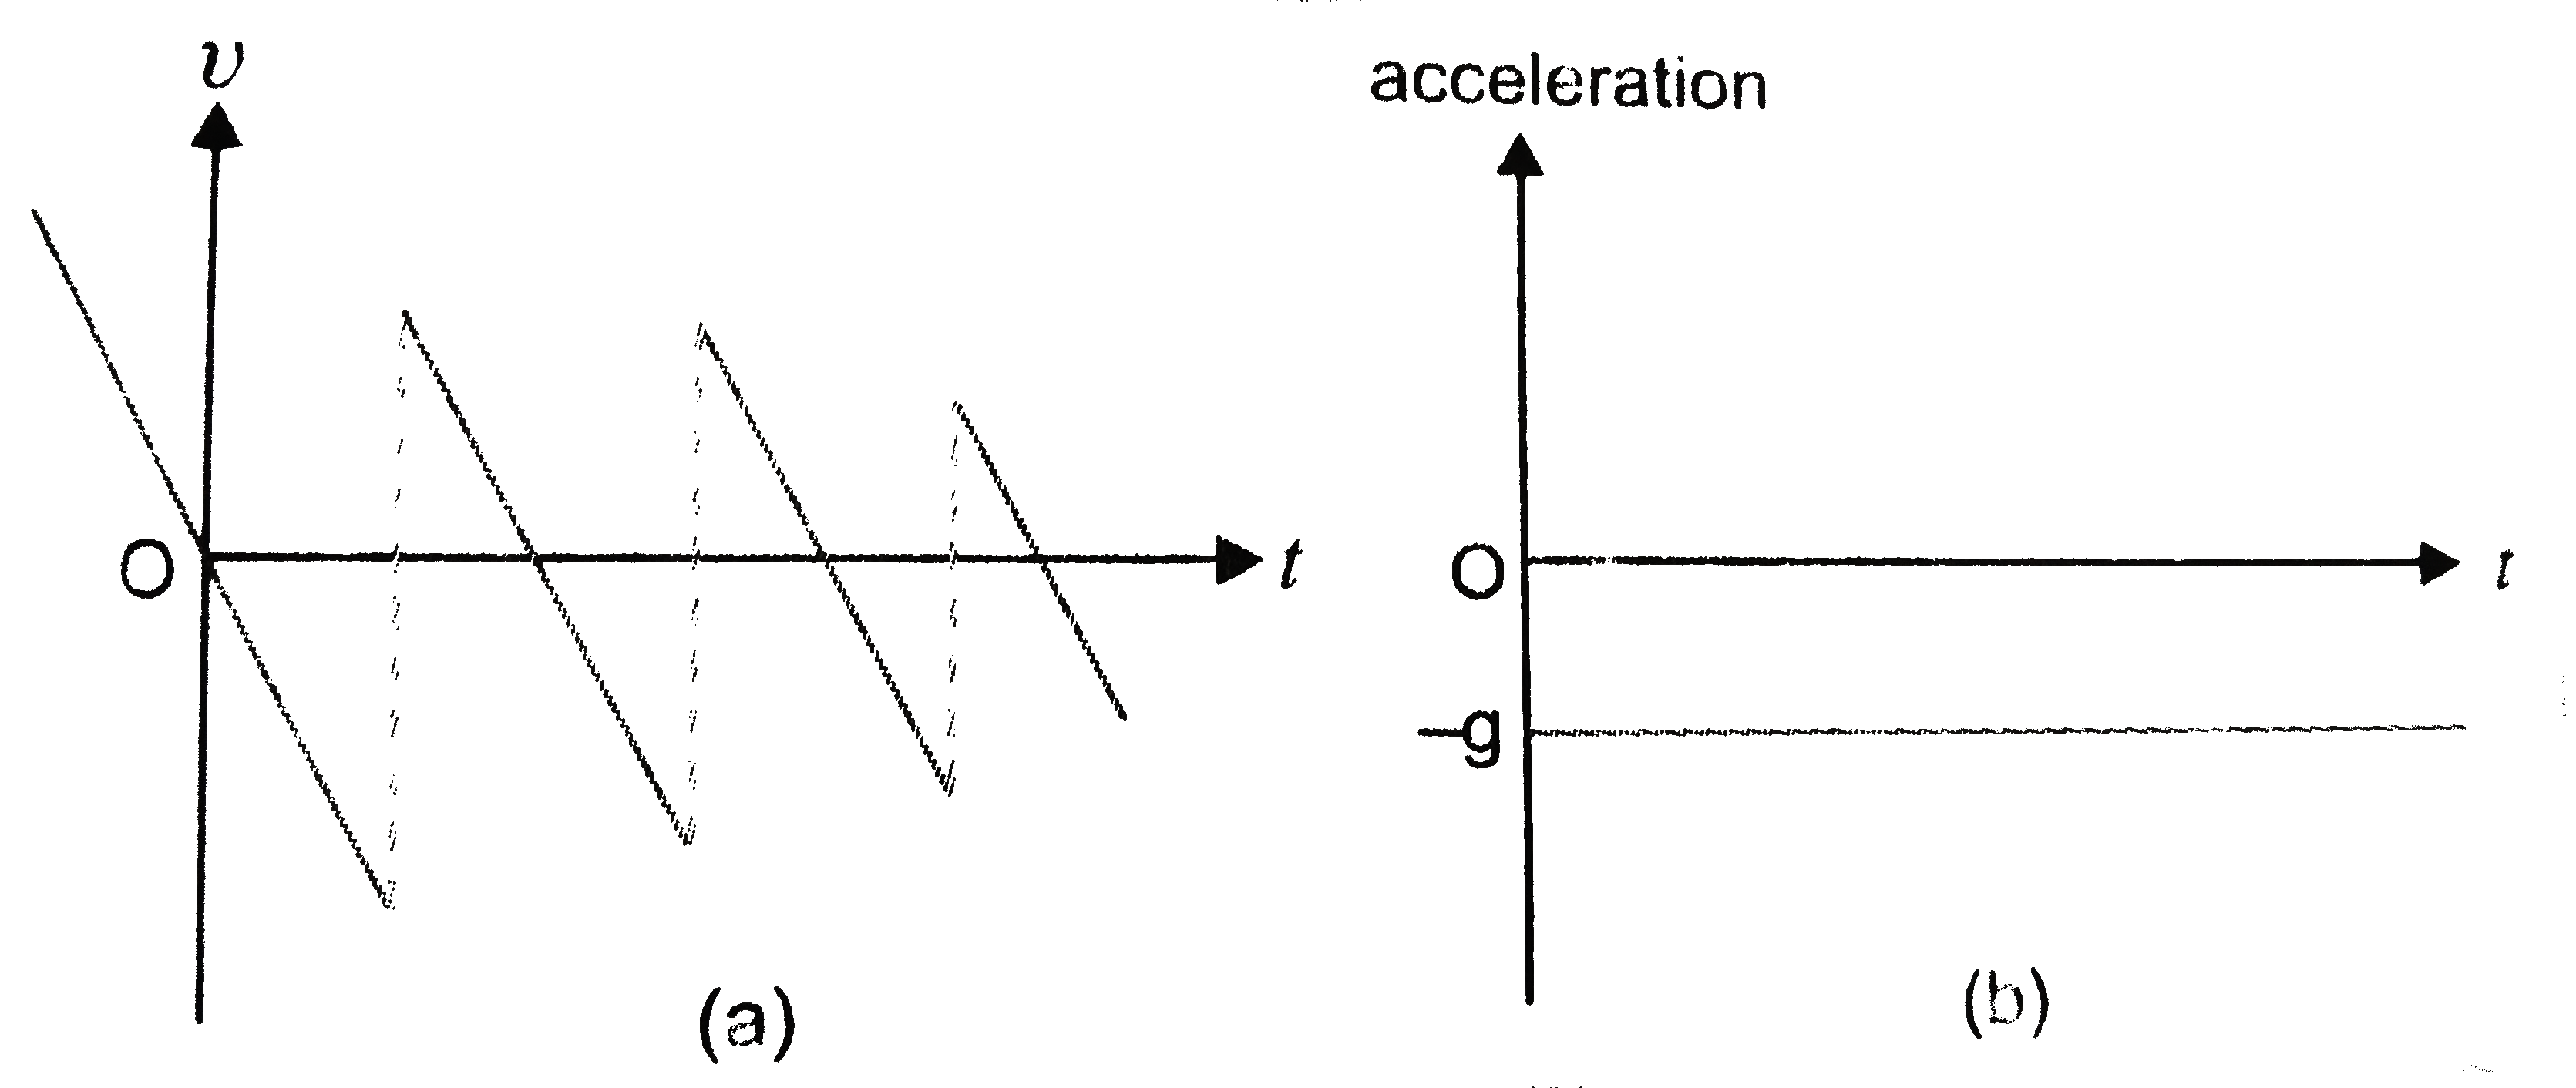
As (x) is positive upwareds and ball is dropped from from a heitht, so velocity of ball increases downwards due to gravity pull. Therefore, (v) is negative. The acceleration of the ball is downwards and is equal to acceleration due to gravity (=- g). After rebound the ball goes upwards, its velocity is positve, but acceleration is-g. Therefore,slope v−t graph is same at every rebunding of ball.
(a) The velocity vs time graph is shown in Fig. 2 (EP). 8 (a) and
(b) acceleration vs time graph is shown in Fig. 2 (EP) .8 (b).
 .
.
|
Updated on:21/07/2023
Related Playlists
- BOOK - PRADEEPCHAPTER - KINEMATICSEXERCISE - 6 Short answer8videos
KINEMATICS
- BOOK - PRADEEPCHAPTER - KINEMATICSEXERCISE - 1 Long answer2videos
KINEMATICS
- BOOK - PRADEEPCHAPTER - KINEMATICSEXERCISE - 4 Short answer30videos
KINEMATICS
- BOOK - PRADEEPCHAPTER - GRAVIATIONEXERCISE - Assertion-Reason Type Questions19videos
GRAVIATION
- BOOK - PRADEEPCHAPTER - LAWS OF MOTIONEXERCISE - Assertion- Reason Type Questions17videos
LAWS OF MOTION
Similar Practice Problems
- Question 1 - Select One
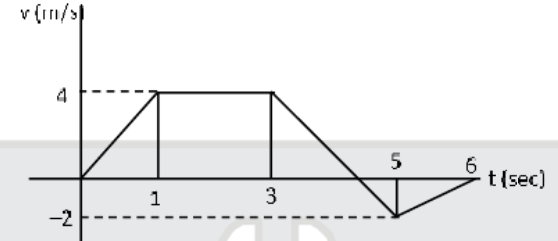
velocity time graph of a particle is shown in figure. Find displacement of the particle.
 A7B11C5D15
 - Question 1 - Select One
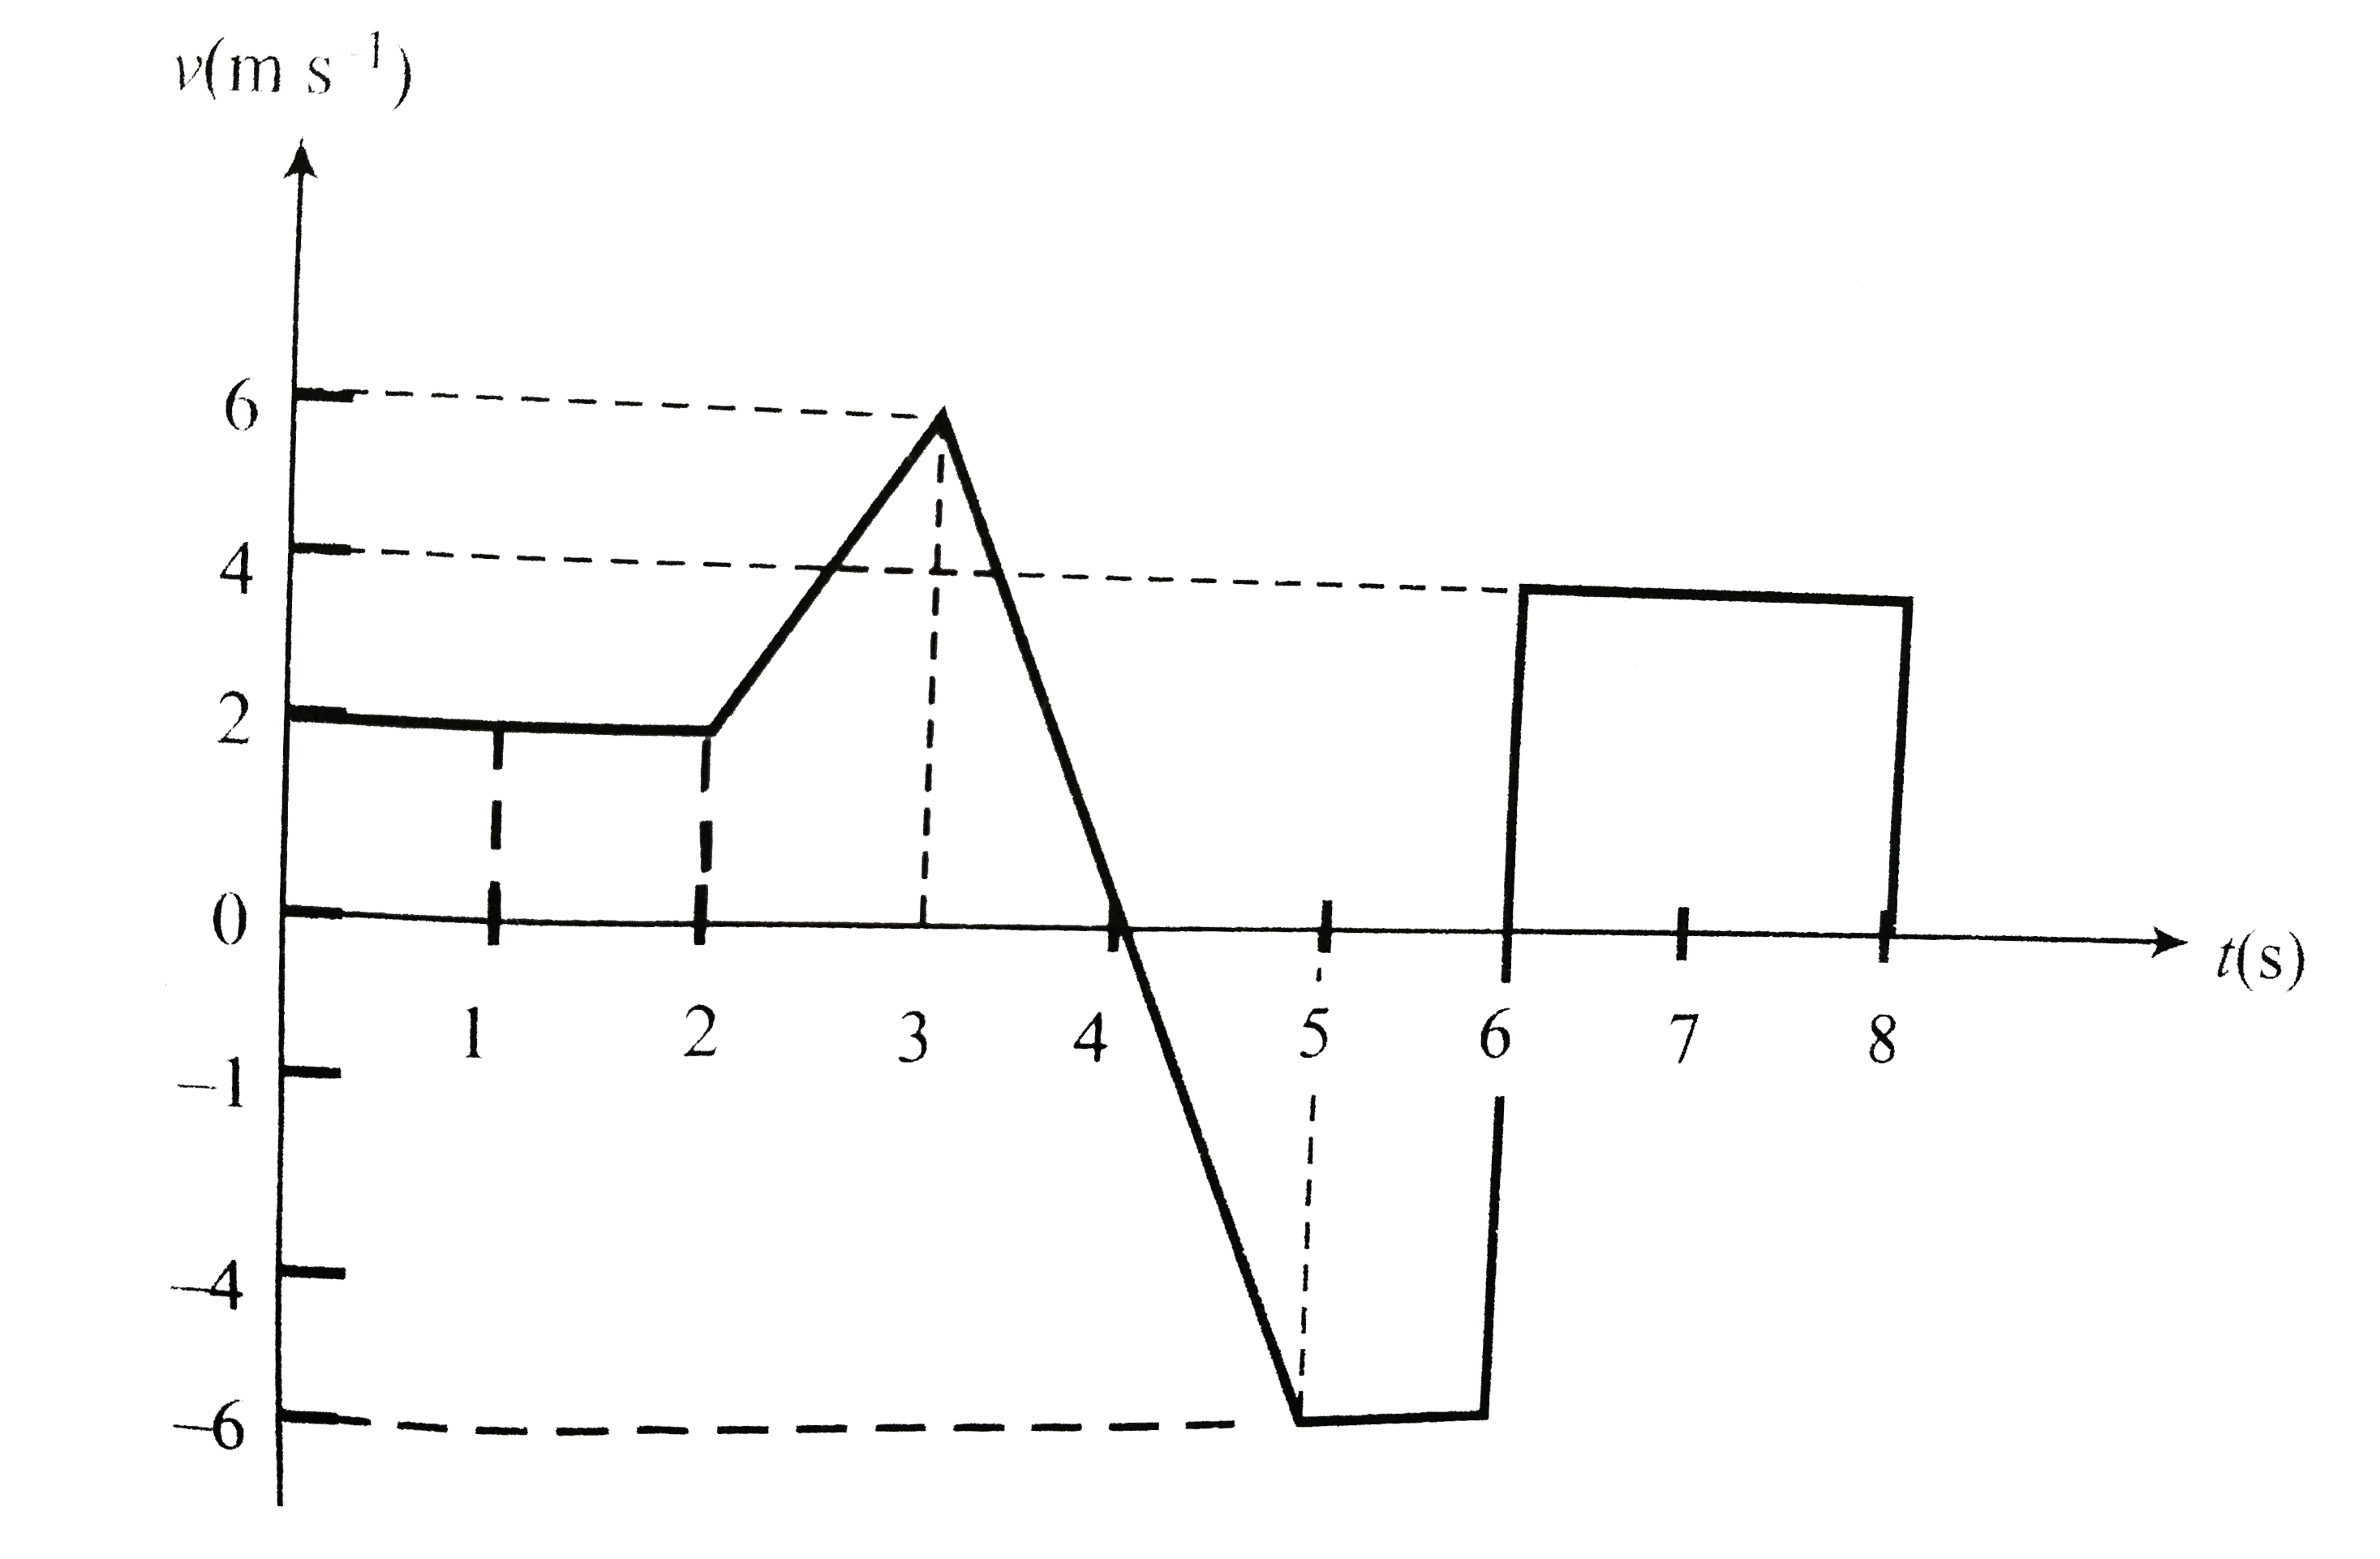
The velocity-time graph of a body is shown in .
The displacement of the body in 8s is.
 .A9mB12mC10mD28m
 - Question 1 - Select One
The displacement-time graph of a particle is as shown below. It indicates that
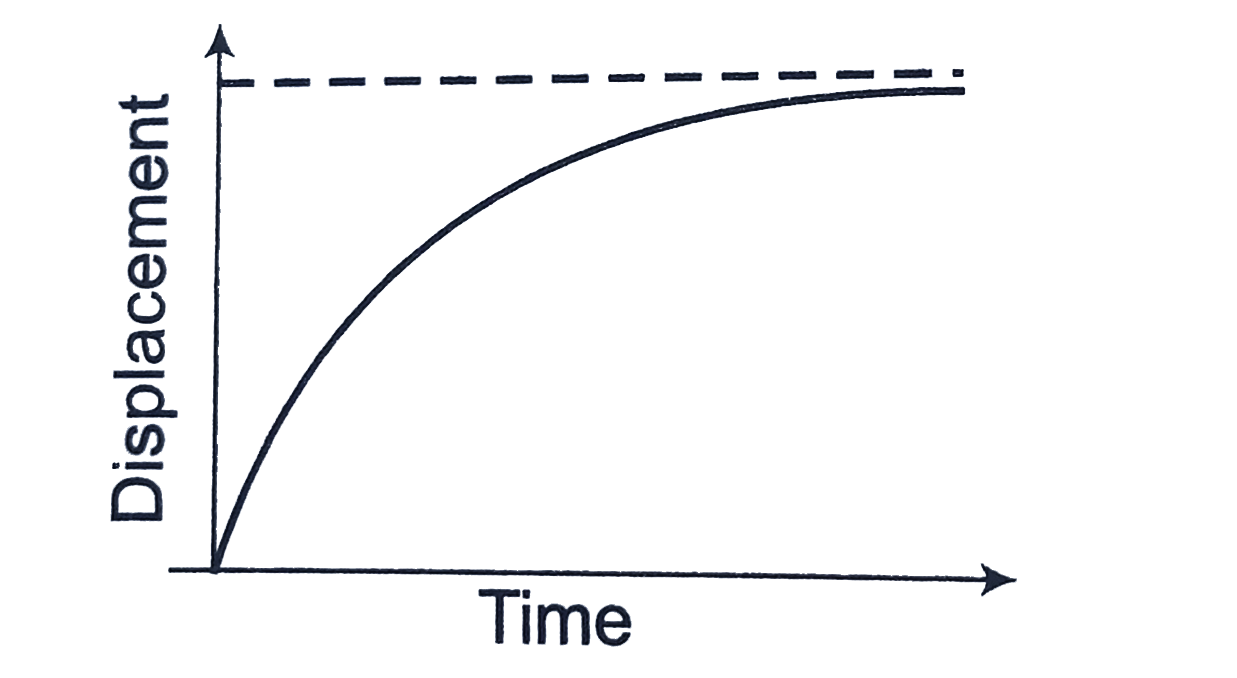 Athe particle starts with a certain velocity but the motion is retarded and finally the particle stopsBthe velocity of the particle is constant throufgoutCthe acceleration of the particle is constant throughoutDthe particle starts with a velocity, the motion is accelerated and finally the particle moves with a constant velocity
 - Question 1 - Select One
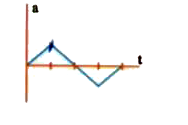
Which of the following v Vs t graph are correct representation for the acceleration Vs time graph shown below
 A
A B
B C
C D
D
Similar Questions
Displacement-time graph is shown in the figure. Displacement
The corresponding distance-time graph isView SolutionThe velocity of particle (whose displacement time graph is shown) at t=3
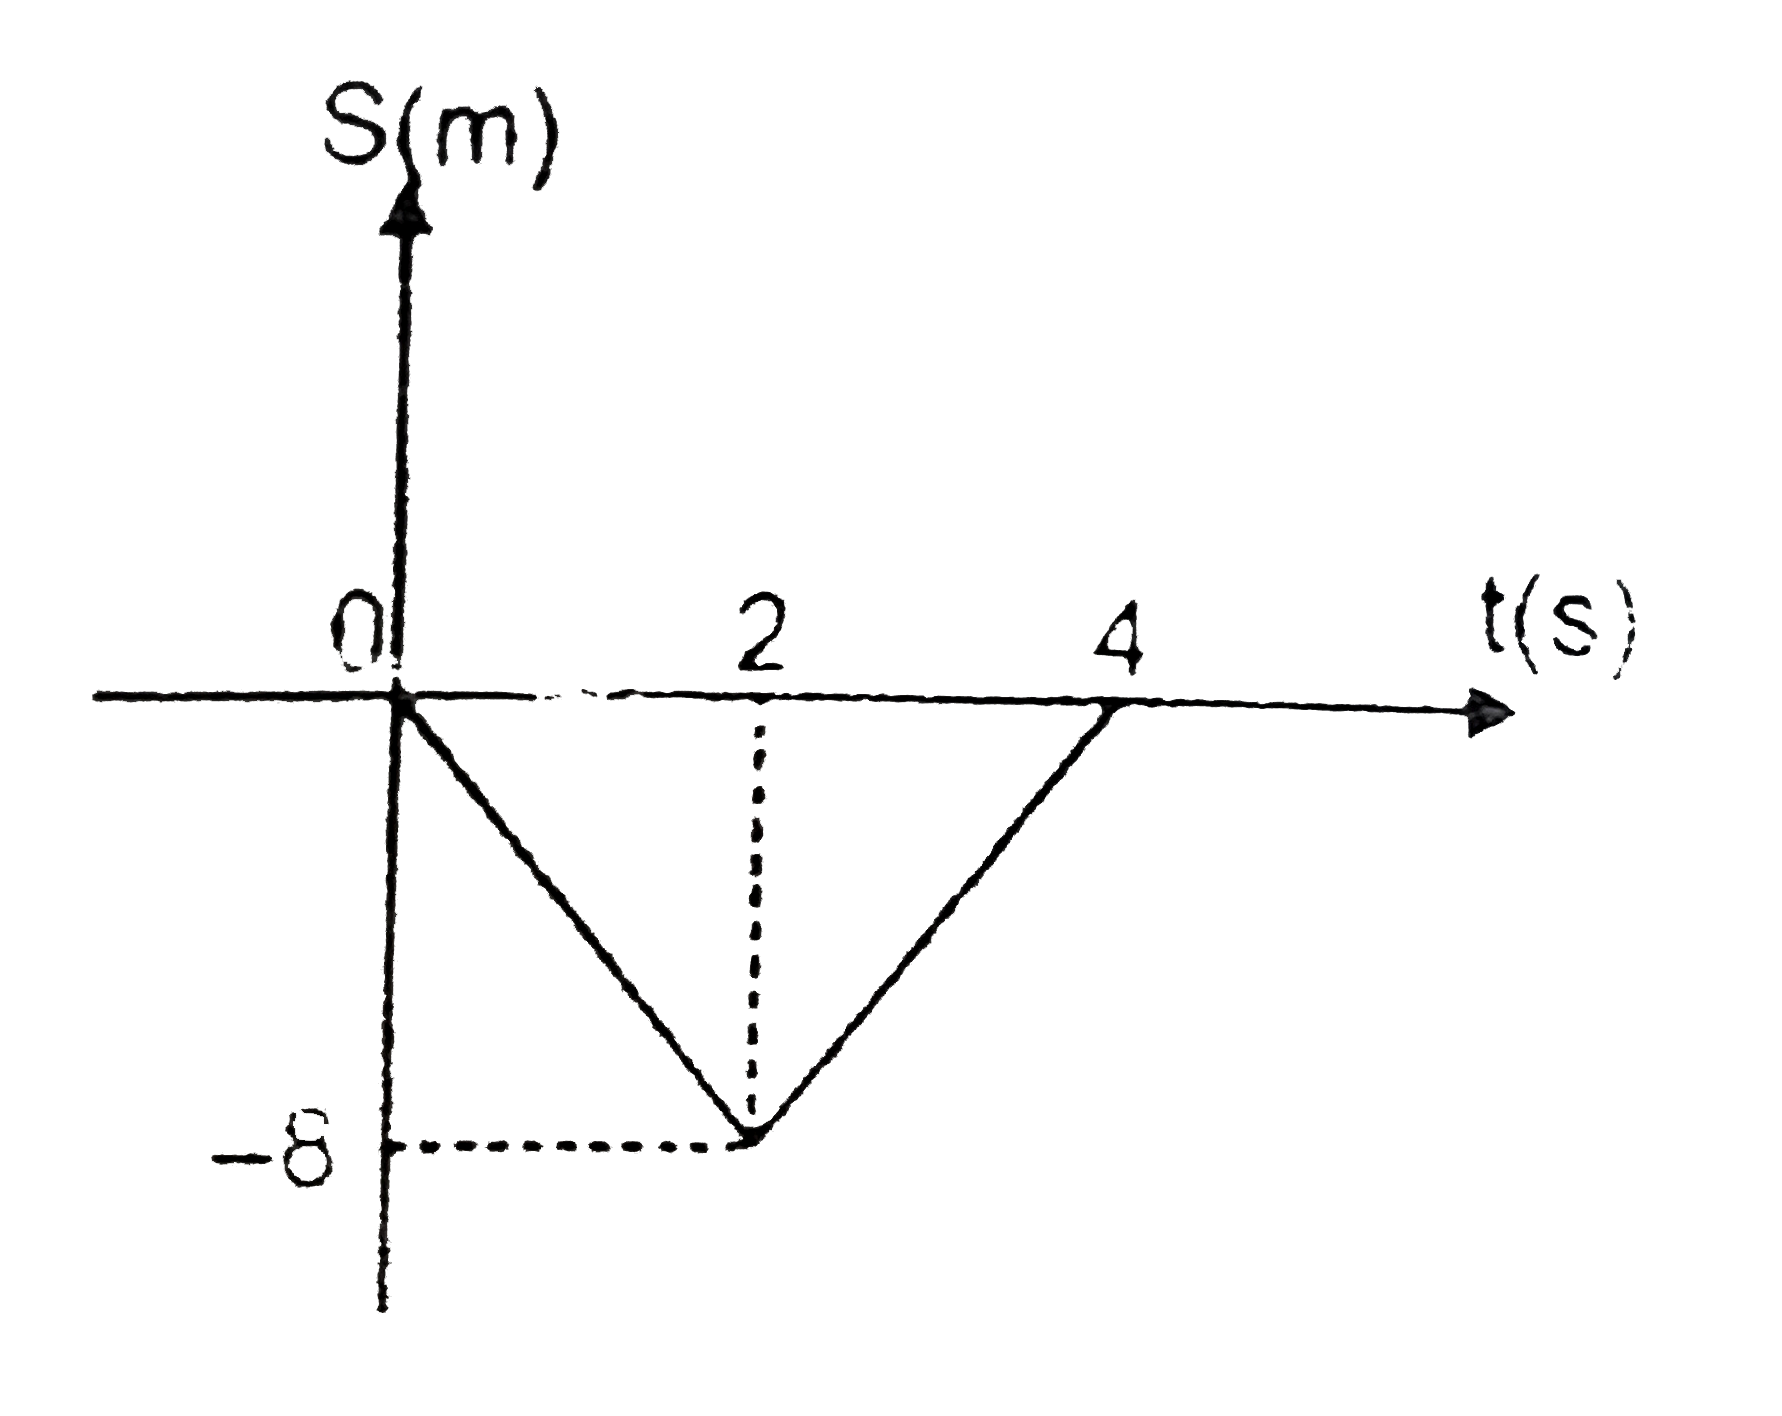 .View Solution
" Find corresponding velocity - time graph for given displacement-time graph "
View SolutionDraw (a) displacement time graph pf a particular executing SHM with phase angleϕequal to zero (b) velocity time graph and (c) acceleration time graph of the particle.
View SolutionAn object is thrown upward with a velocity u, then displacement -time graph is
View SolutionExplain the following temperature Vs. time graph:
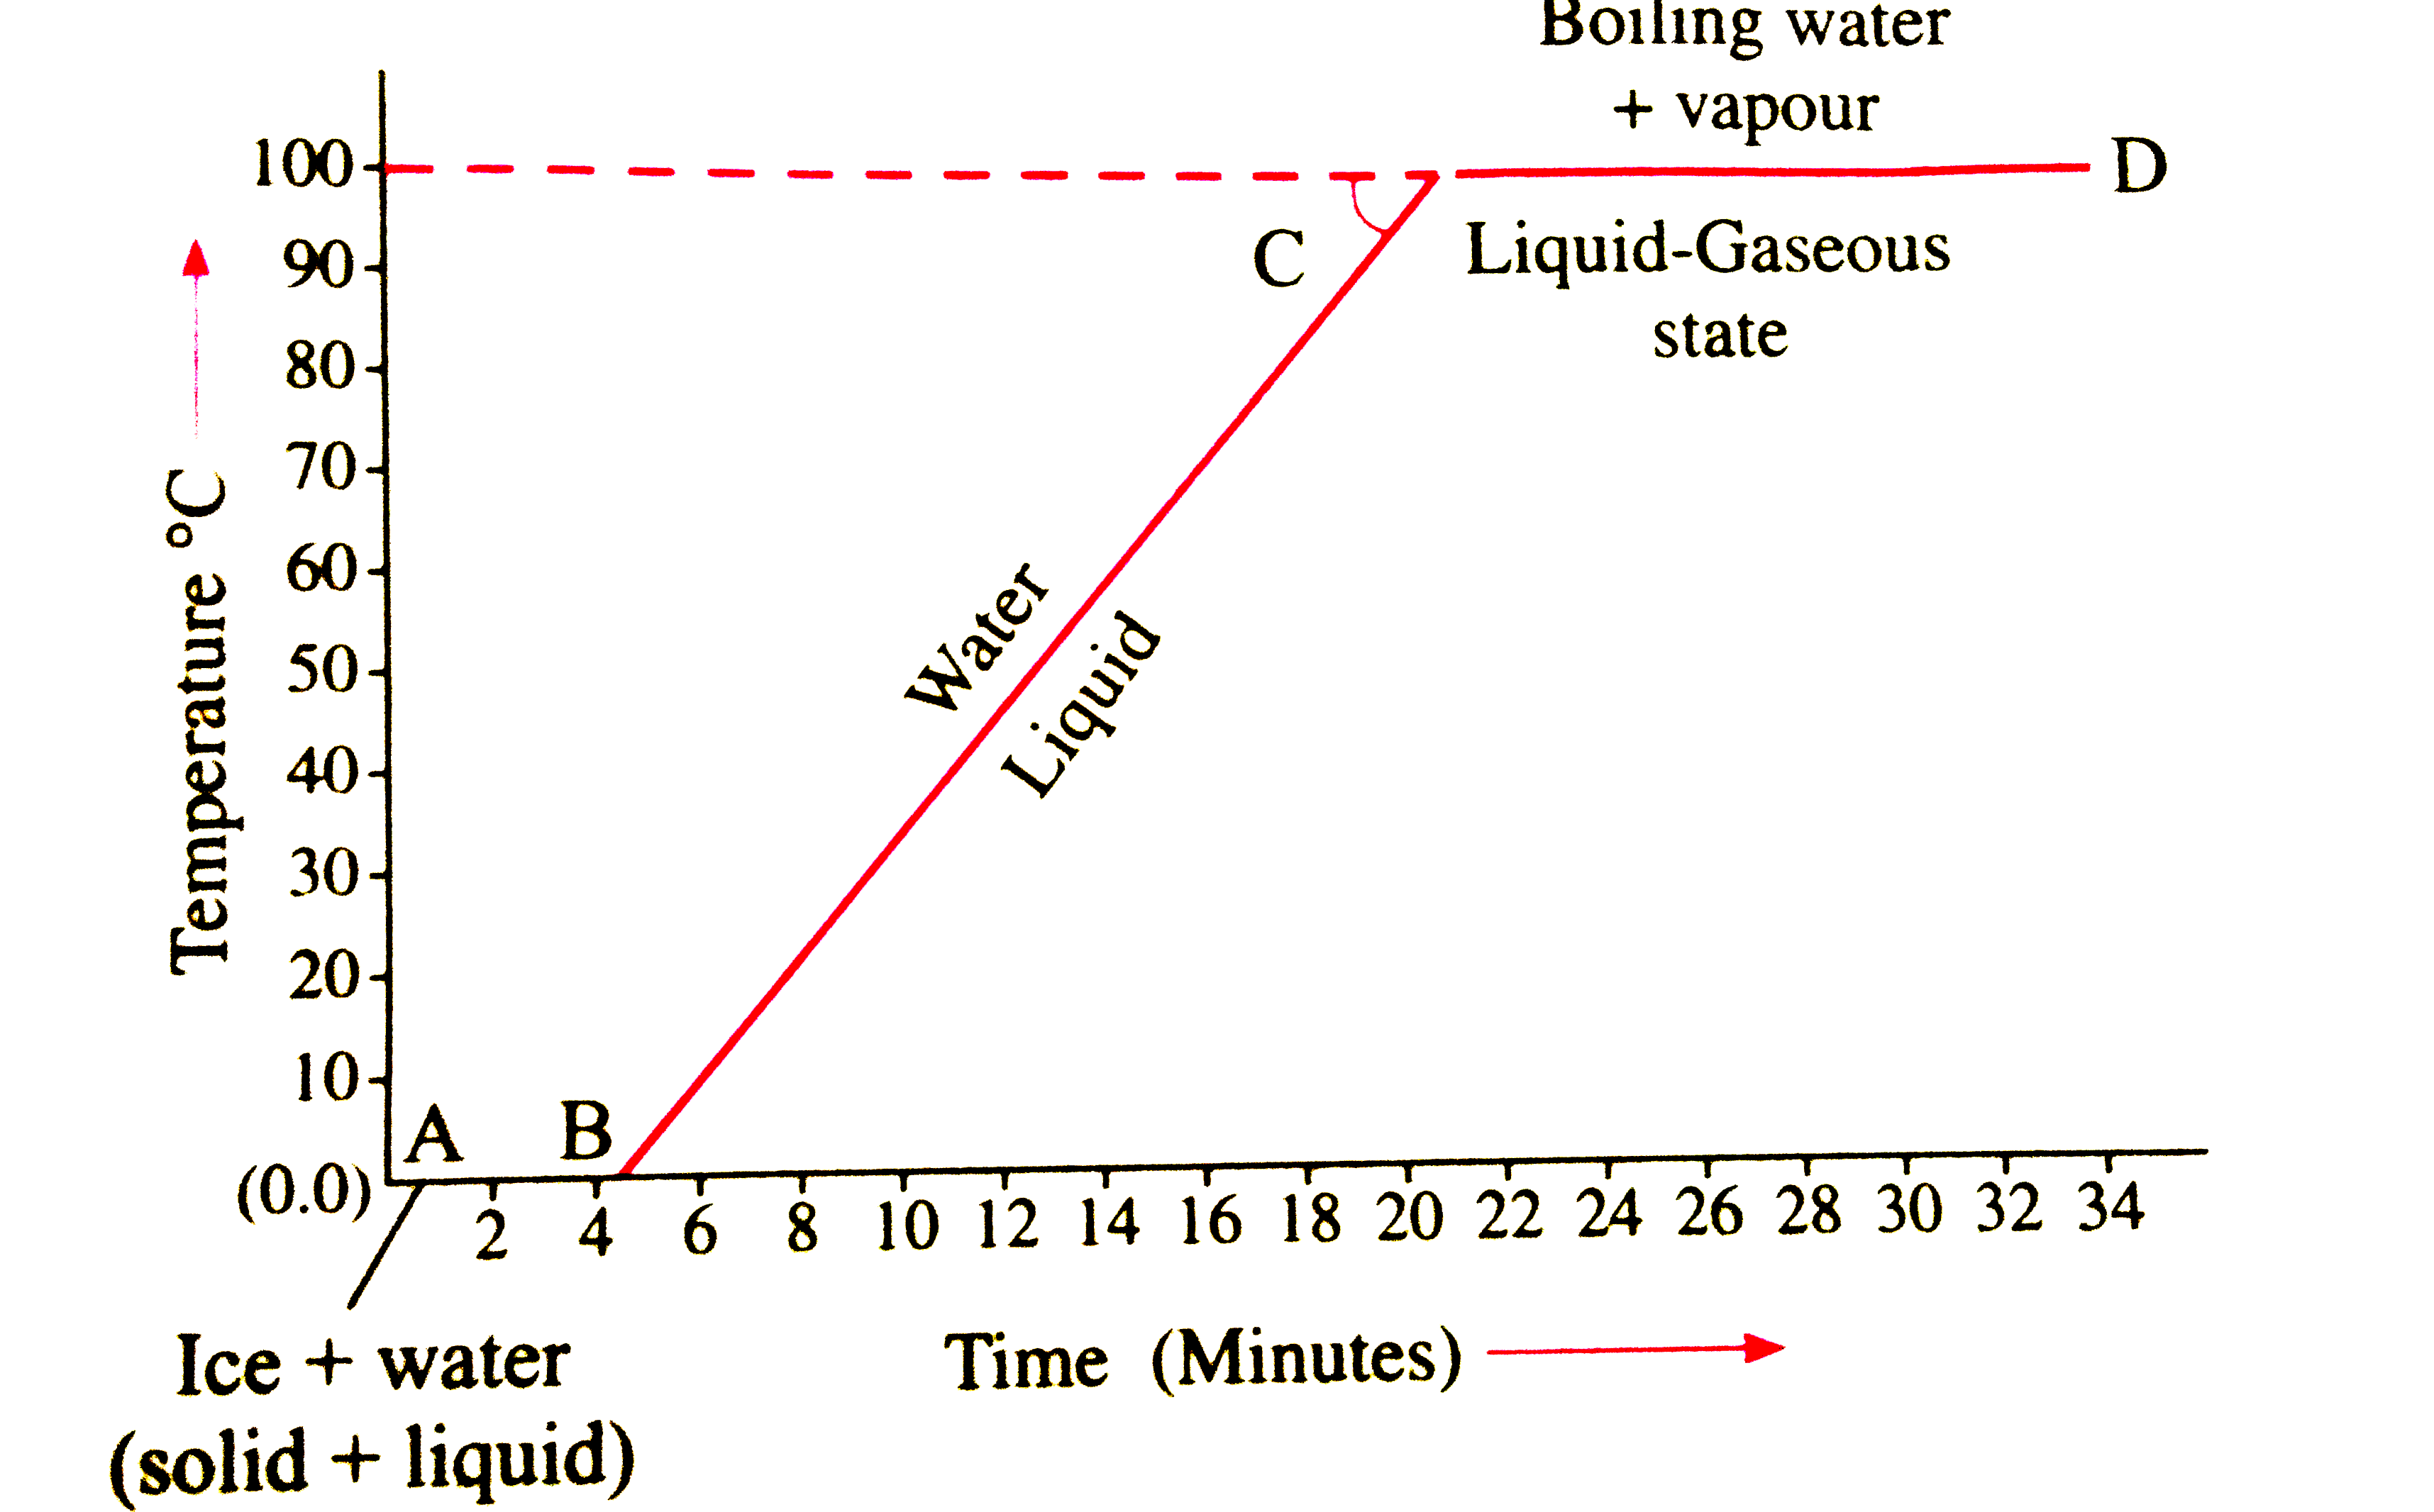 View Solution

