The curve showing the variation of adorpton with pressure at constant temperature is called :
A
an isostherm
B
adsorpton isotherm
C
absorption isotherm
D
all of these
Video Solution
Text Solution
The correct Answer is:B
Plots of adsorpton with pressure at constanct (T) are referred as adsoption isotherms .
|
Updated on:21/07/2023
Related Playlists
Knowledge Check
- Question 1 - Select One
The curve between adsorption and pressure at constant temperature is called as
Aadsorption isothermBadsorption isobarCAdsorbateDAdsorbent - Question 1 - Select One
A curve showing the variation of extent of adsorption with temperature at constant pressure is called……………
Aadsorption isothermBadsorption isobarCabsorption isothermDadsorption isobar - Question 1 - Select One
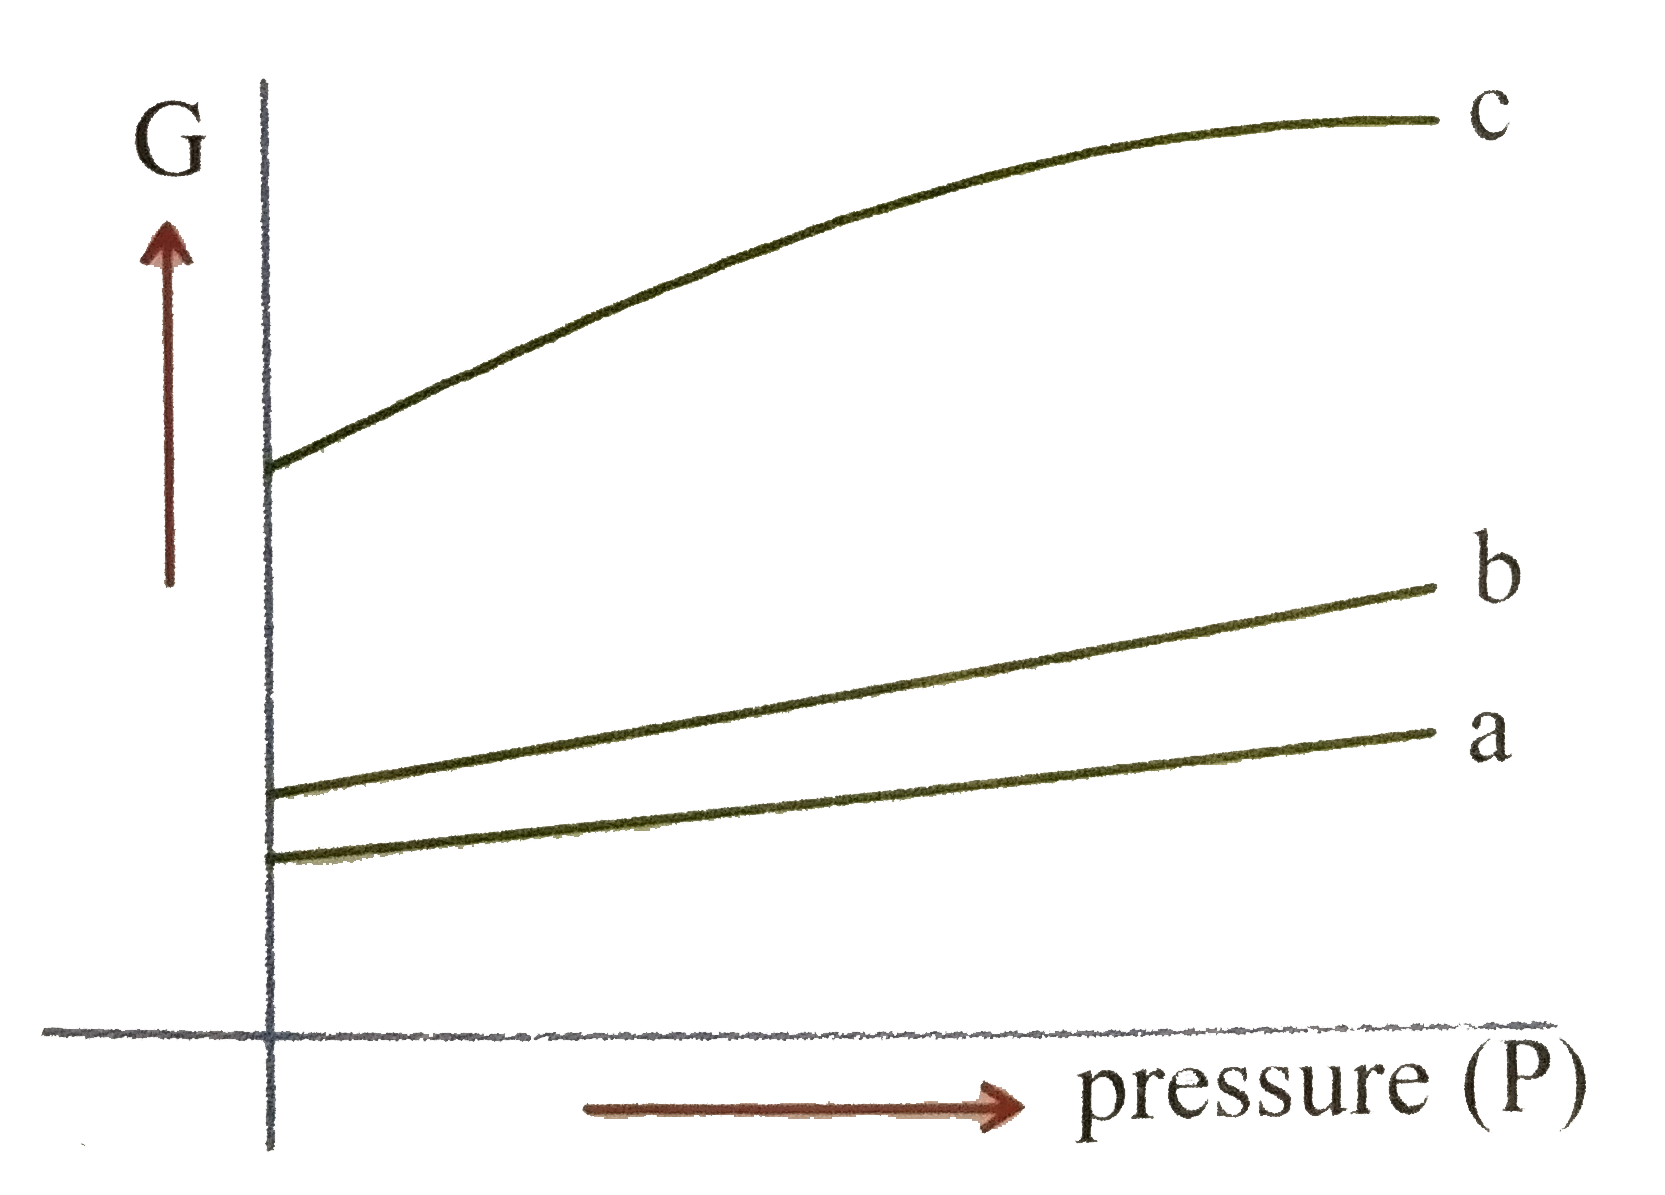
The following curve represnets the variation of Gibbs function 'G' with pressure at constant temperature.

Correct match of given plots with the physical state of a substance isAc- solid, a - gas, b - liquidBc - gas, b- liequid, a - solidCa - liquid, b - solide, c - gasDc - gas, b - solid, a - liquid - Question 1 - Select One
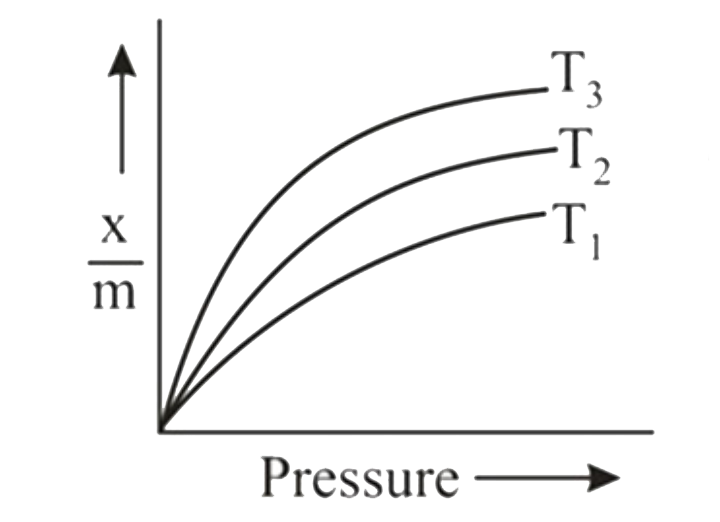
The variation of extent of adsorption with pressure at a given constant temperature is given in following figure

Which of the following relation between temperature of isotherms is correct ?AT1=T2=T3BT1<T2<T3CT3<T2<T1DT1<T2>T3 - Question 1 - Select One
The variation in the amount of gas adsorbed by the adsorbent with pressure at constant temperature can be expressed by means of a curve termed as adsorption
AisobarBisothermCisochoreDisostere - Question 1 - Select One
The relationship which describes the variation of vapour pressure with temperature is called
AHess's lawBArrhenius equationCKirchoff's lawDClausis-Clapeyron equation - Question 1 - Select One
The curve showing the variation of pressure with temperature for a given amount of adsoption is called
 Aadsorption isobarBadsorption isothermCadsorption isotereDadsorption isochore
 - Question 1 - Select One
The curve showing the variation of pressure with temperature for a given amount of adsorption is called
Aadsorption isobarBadsorption isothermCadsorption isostereDadsorption isochore.

