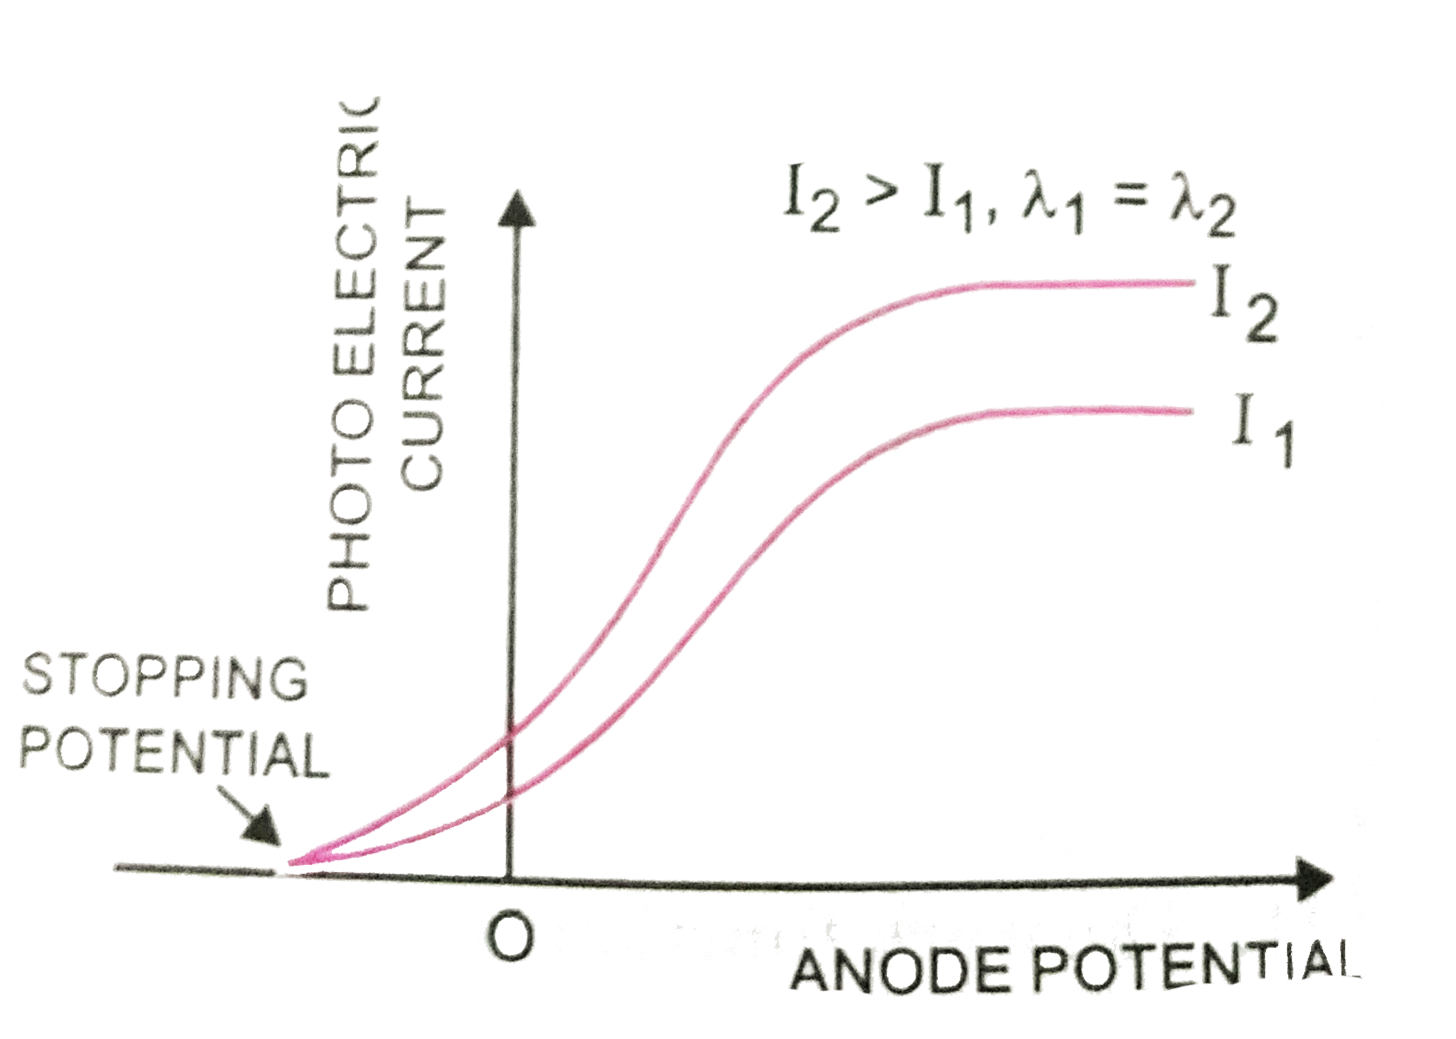
Plot a graph showing the variation of photoelectric current with anode potential for two light beam of same wavelength but different intensity.
The graph is shown in fig.
Related Playlists
- BOOK - PRADEEPCHAPTER - DUAL NATURE OF RADIATION AND MATTEREXERCISE - NCERT Exerciese question1videos
DUAL NATURE OF RADIATION AND MATTER
- BOOK - PRADEEPCHAPTER - DUAL NATURE OF RADIATION AND MATTEREXERCISE - Short answer1videos
DUAL NATURE OF RADIATION AND MATTER
- BOOK - PRADEEPCHAPTER - CURRENT ELECTRICITYEXERCISE - Problems for Practice (B)2videos
CURRENT ELECTRICITY
- BOOK - PRADEEPCHAPTER - ELECTROMAGNETIC INDUCTION & ALTERNATING CURRENTEXERCISE - Multiple Choice Questions1videos
ELECTROMAGNETIC INDUCTION & ALTERNATING CURRENT
Knowledge Check
- Question 1 - Select One
Variation of photeoelectric current with anode potential is shown below. Choose the correct option.
A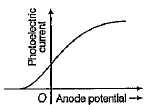 B
B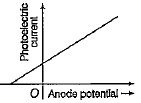 C
C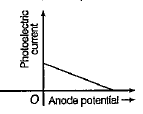 D
D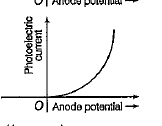
Similar Questions
Draw suitable graphs to show the variation of photoelectric current with collector plate potential for
(i) a fixed frequency but different intensities I1>I2>I3 of radiation.
(ii) a fixed intensity but different frequencies v1>v2>v3 of radiation.View SolutionDarw graphs showing variation of photoelctric current with applied voltage for two incident radiations of equal frequecny and different intensities. Mark the graph for the radiaiton of higher intensity.
View SolutionDarw graphs showing variation of photoelctric current with applied voltage for two incident radiations of equal frequecny and different intensities. Mark the graph for the radiaiton of higher intensity.
View SolutionDraw graphs showing variation of photoelectric current with applied voltage for three incident radiations of equal frequency and different intensities. Mark the graph for the radiation of higher intensity.
View SolutionDraw a plot showing the variation of photoelectric current with collector plate potential for two different frequencies, v1>v2 of incident radiation having the same intensity. In which case will the stopping potential be higher? Justify your answer.
View SolutionDraw a plot showing the variation of photoelectric current with collector plate potential for two different frequencies, v1>v2, of incident radiation having the same intensity. In which case will the stopping potential be higher ? Justify your answer.
View SolutionPlot a graph showing variation of current versus voltage for the material GaAs
View SolutionDraw a plot showing the variation of photoelectric current with collector plate potential for two different frequenciesv1andv2(v1>v2) of incident radiation having the same intensity. In which case will the stopping potential be higher? Justify your answer.
View SolutionPlot a graph showing variation of current versus voltage for the material Ga.
View Solution

