Sketch a graph between frequency of incident radiations and stopping potential for a given photosenstive material. What information can be obtained from the value of the intercept on the potential axis? A source of light of frequency greater than the threshold frequency is placed at a distance of 1m from the cathode of a photocell. The stopping potential is found to be V. If the distance of the light source from the cathode is reduced, explain giving reasons, what change will you observe in the (i) photoelectric current (i) stopping potential?
For graph intercept on the potential axis=−ϕ0/e. If the distance of the light source of the cathode is reduced, then (i) the photoelectric current is increases because the intensity of incident radiation increases. (ii) the stopping potential V0 remains the same because it is independent of the intensity of the incident radiations.
Related Playlists
- BOOK - PRADEEPCHAPTER - DUAL NATURE OF RADIATION AND MATTEREXERCISE - NCERT Exerciese question1videos
DUAL NATURE OF RADIATION AND MATTER
- BOOK - PRADEEPCHAPTER - DUAL NATURE OF RADIATION AND MATTEREXERCISE - Short answer1videos
DUAL NATURE OF RADIATION AND MATTER
- BOOK - PRADEEPCHAPTER - CURRENT ELECTRICITYEXERCISE - Problems for Practice (B)2videos
CURRENT ELECTRICITY
- BOOK - PRADEEPCHAPTER - ELECTROMAGNETIC INDUCTION & ALTERNATING CURRENTEXERCISE - Multiple Choice Questions1videos
ELECTROMAGNETIC INDUCTION & ALTERNATING CURRENT
Similar Practice Problems
- Question 1 - Select One
The slope of frequency of incident light and stopping potential for a given surface will be
AhBh/eCehDe - Question 1 - Select One
A source of light is placed at a distance of 50 cm from a photocell and the stopping potential is found to be V0 . If the distance between the light source and photocell is made 25 cm, the new stopping potential will be
A2V0BV0/2CV0D4V0 - Question 1 - Select One
a source of light in placed at a distance 4m from a photocell and the stopping potential is then 7.7 volt. If the distence is helved the stopping potential now will be
A7.7 voltB15.4 voltC3.85 voltD1.925 volt - Question 1 - Select One
A source of light is placed at a distance of 1 m from a photo cell and the cut off potential is found to be 5 V. If the source is kept at 1.5 m from the cell, then the cut off potential will be
A7.5 VB10 VC5 VD3 V - Question 1 - Select One
Which of the following is the graph between the frequency (v) of the incident radiations and the stopping potential ?
A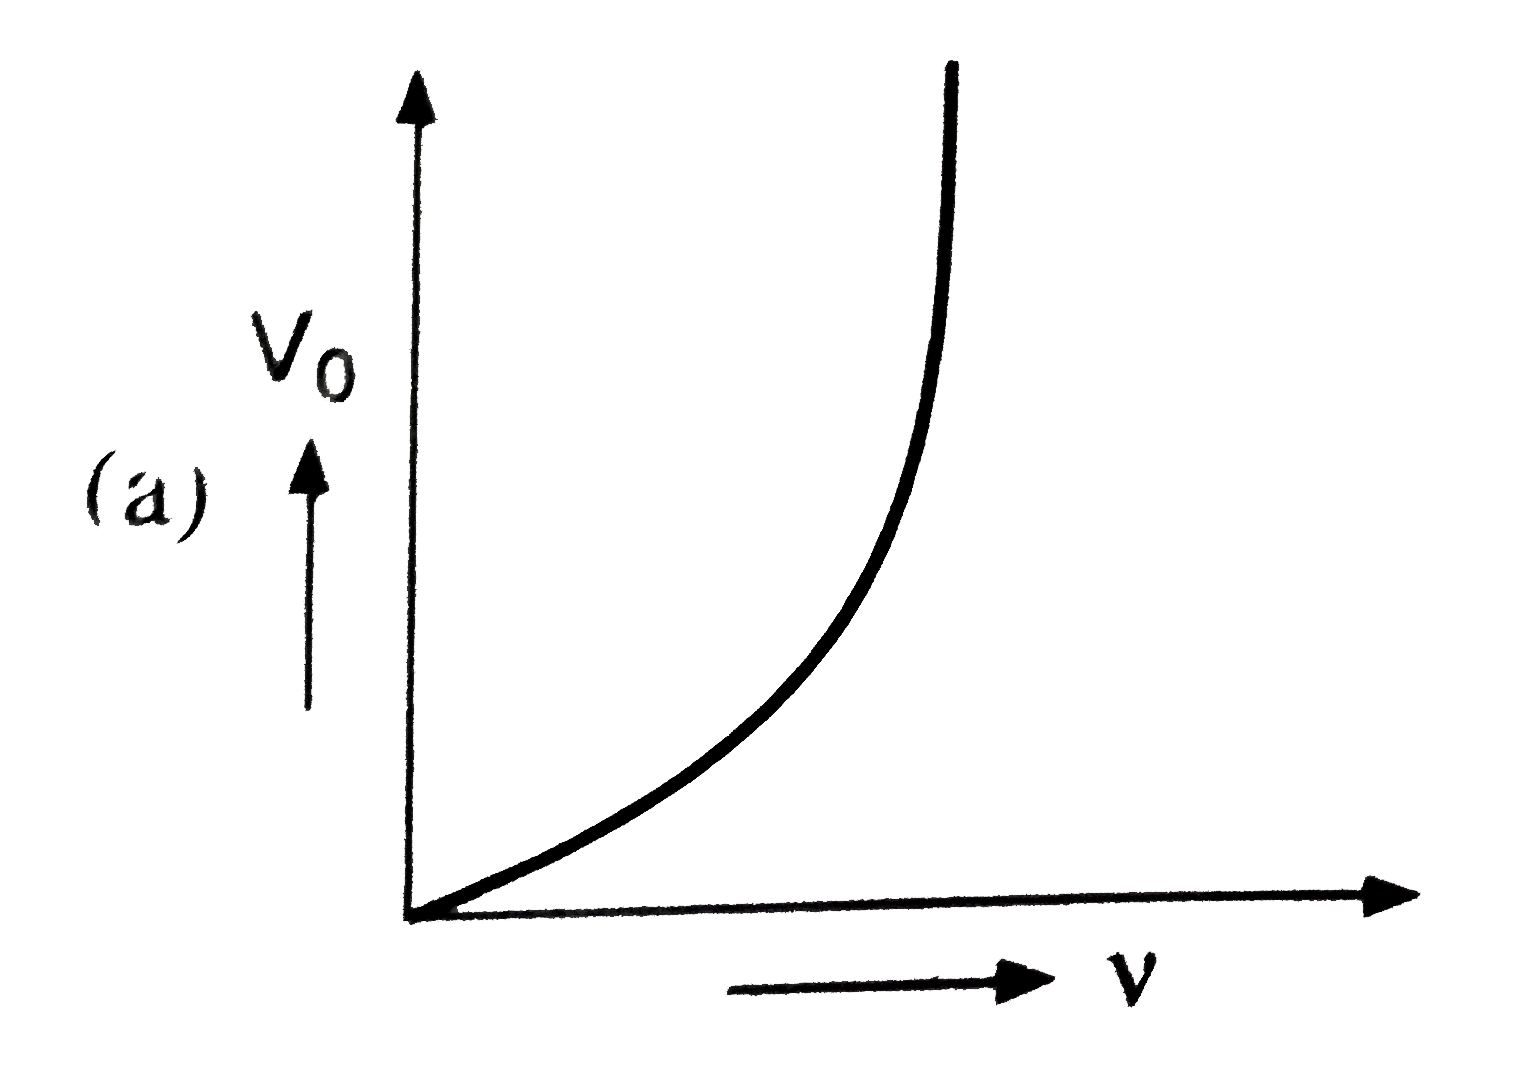 B
B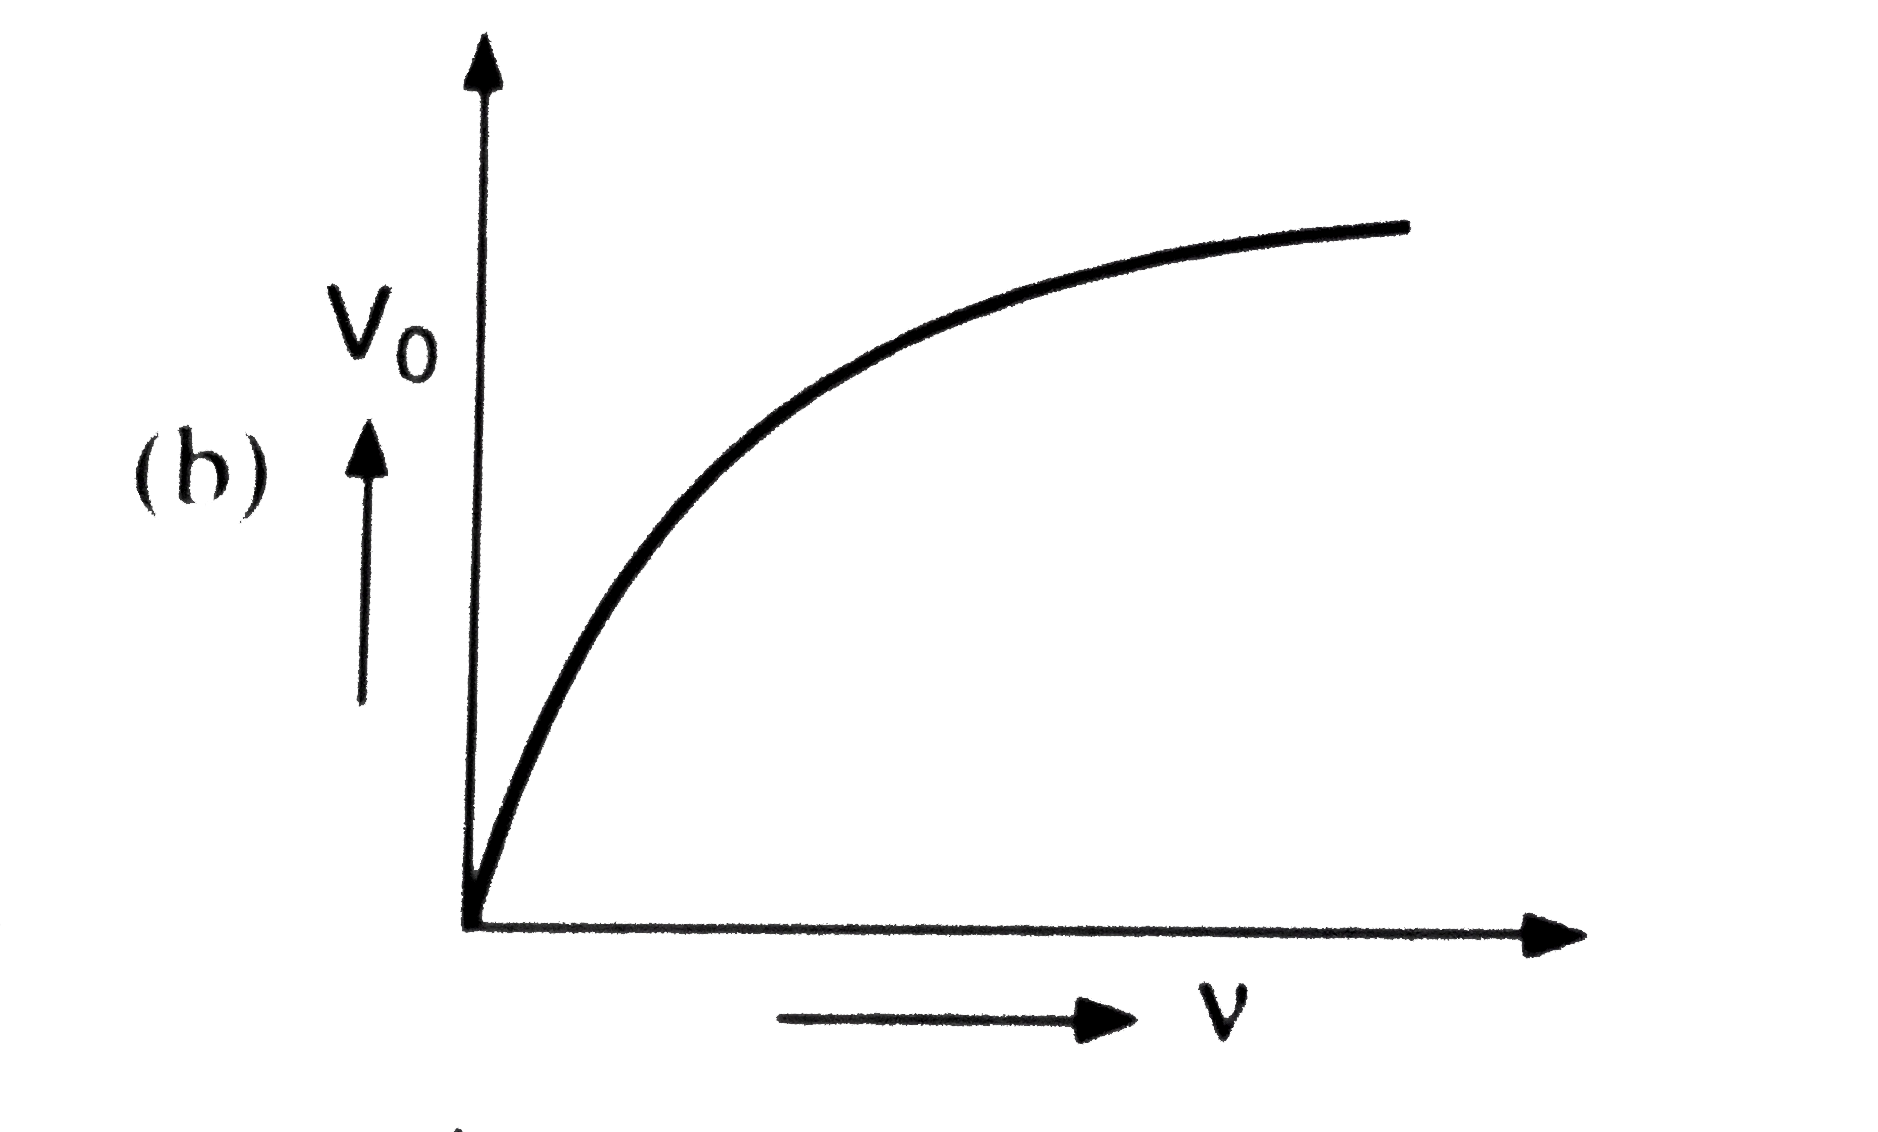 C
C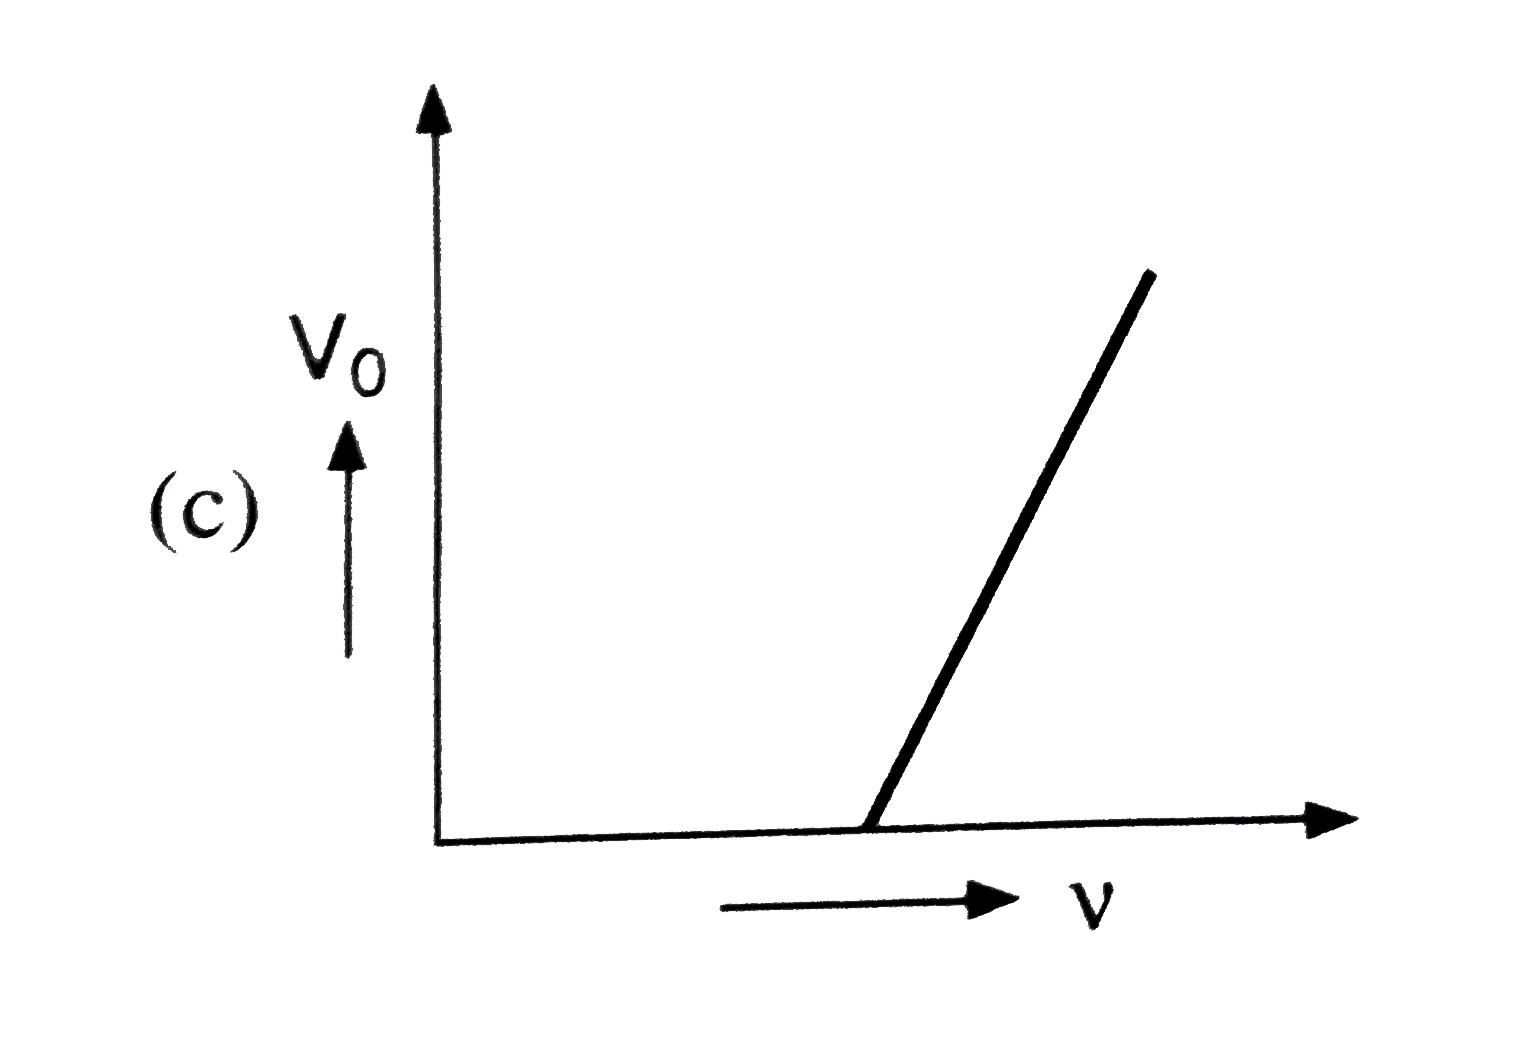 D
D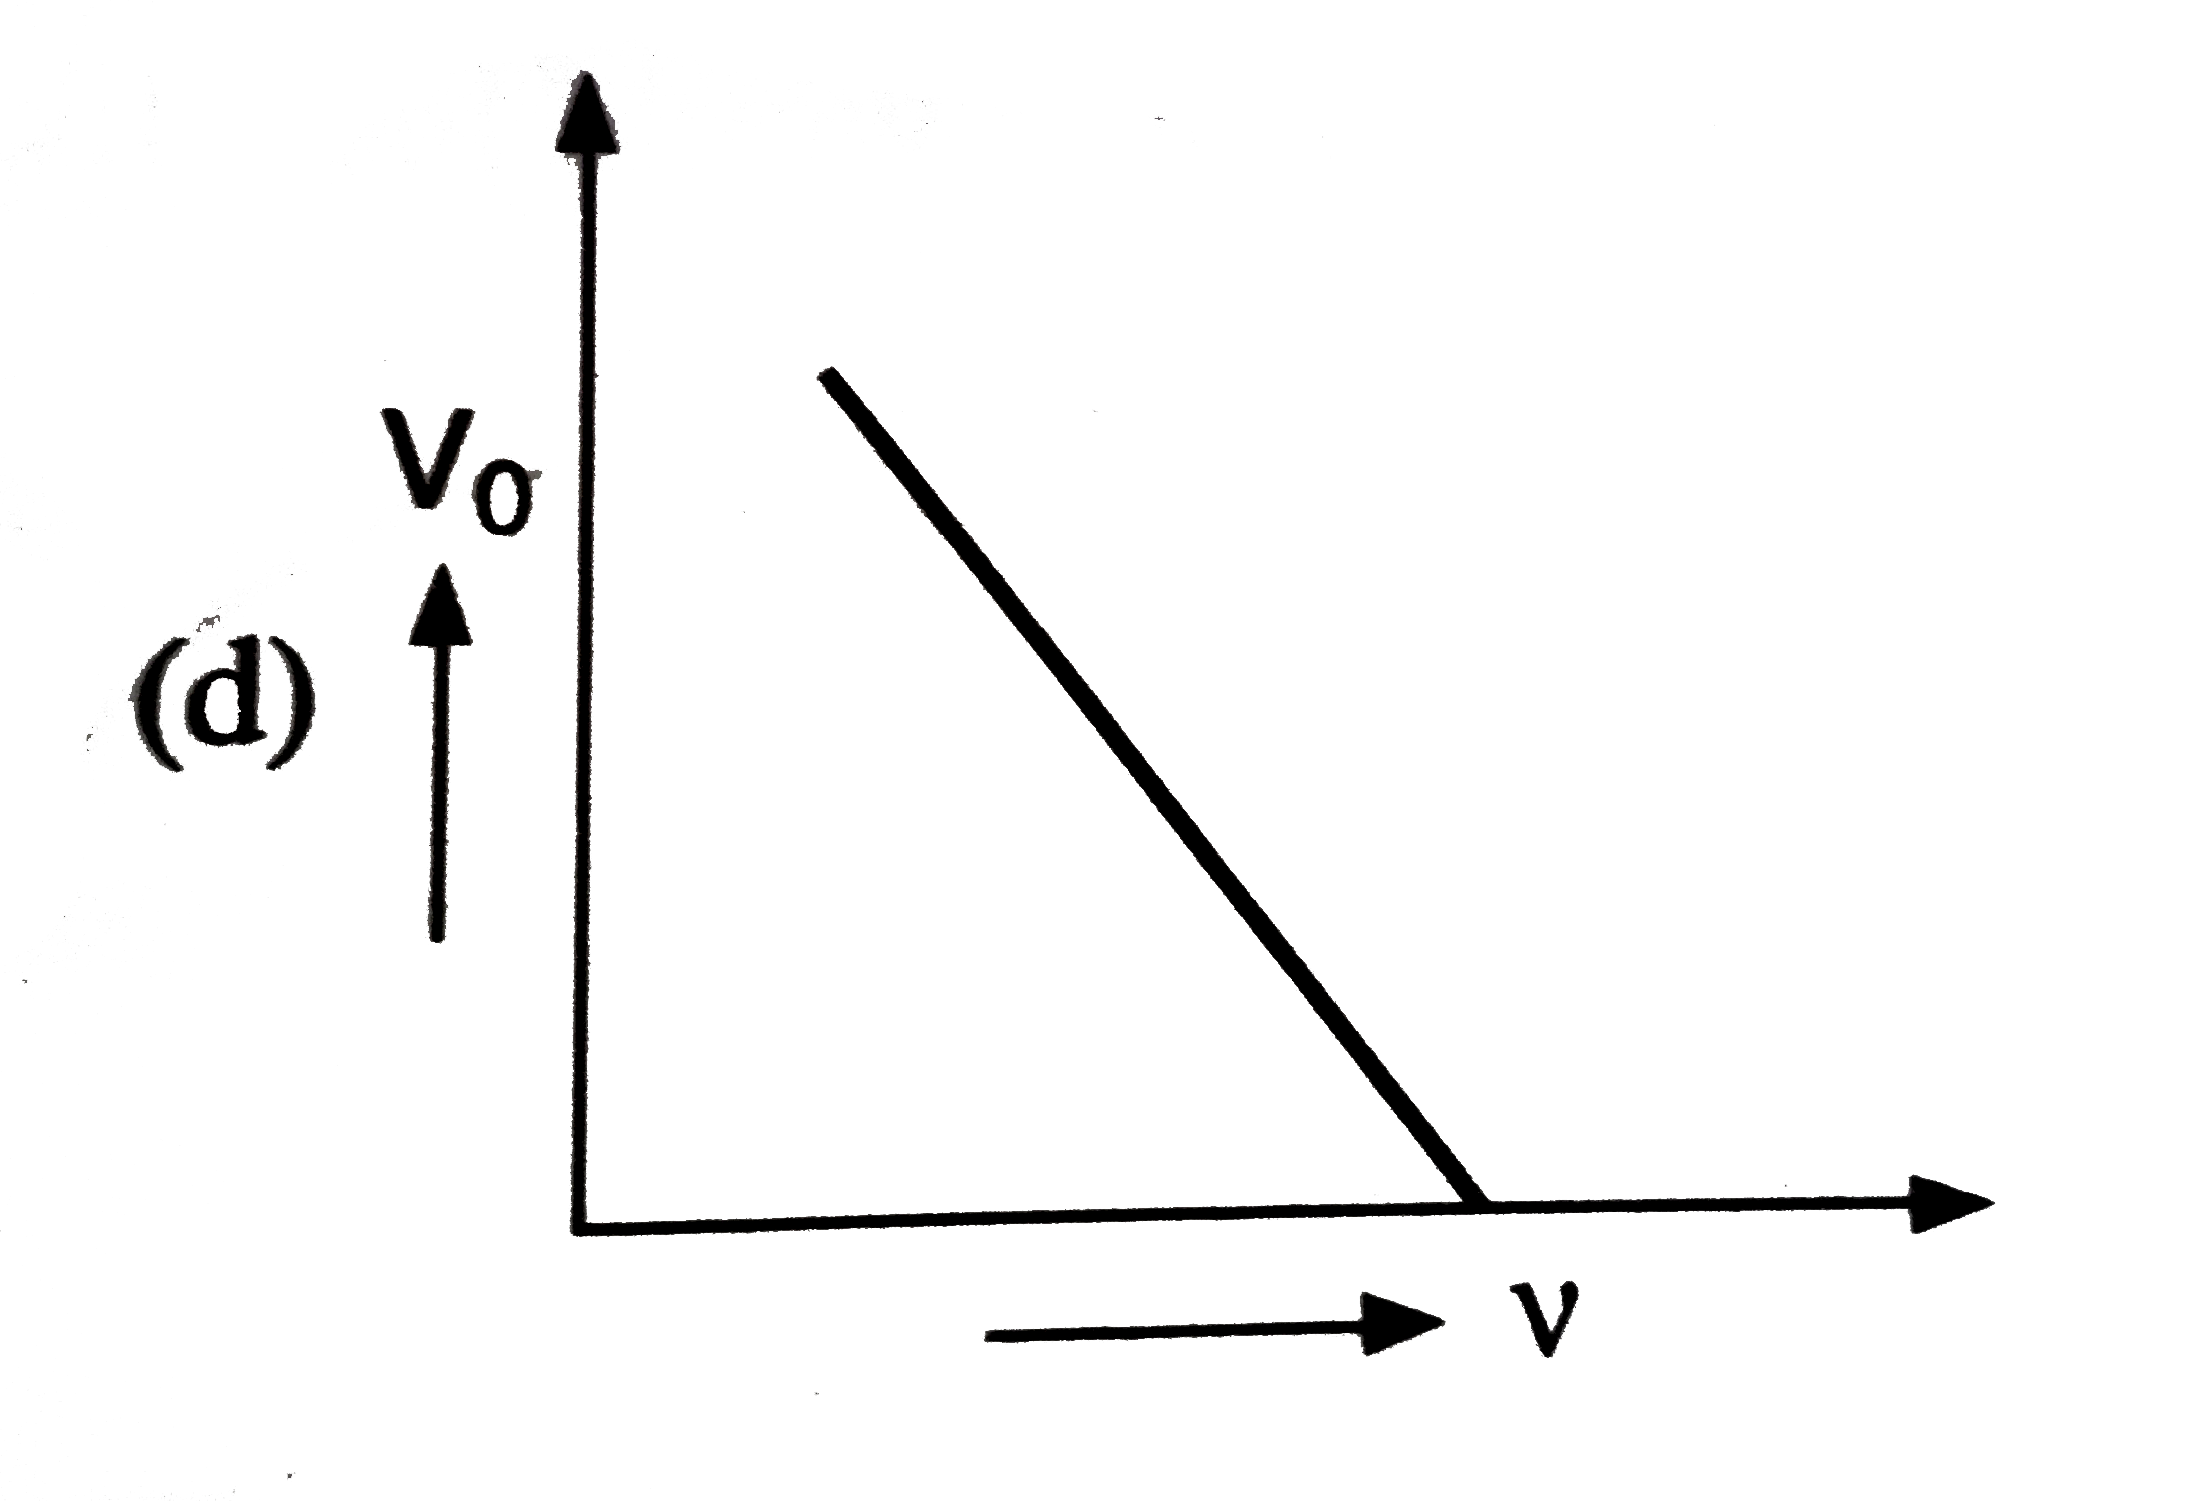
- Question 1 - Select One
Choose the correct option for the graph between the frequency of incident light and the stopping potential.
AIt is a parabolaBIt is a straight lineCIt is a hyperbolaDIt is a circle
Similar Questions
The graph between frequency of incident radiations and stopping potential for a given photosensitive material as follows.
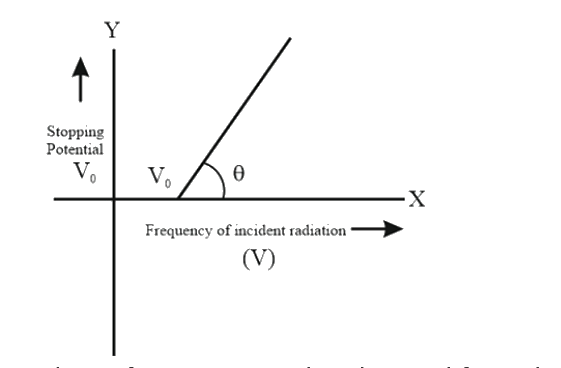
What information can be obtained from the value of the intercept on the potential axis ?View SolutionWhat is the effect of decrease in frequency of incident radiation on the stopping potential in photoelectric emission?
View SolutionA source of light is placed at a distance of 1m. From a photocell and the cut off potential is found to be V0. If the distance is doubled what will be the cut off potential?
View SolutionDraw a graph showing the variation of stopping potential with frequency of the incident radiation. What does the slope of the line with frequency axis indicate? What information can be obtained from the values of intercept on the potential axis?
View Solution

