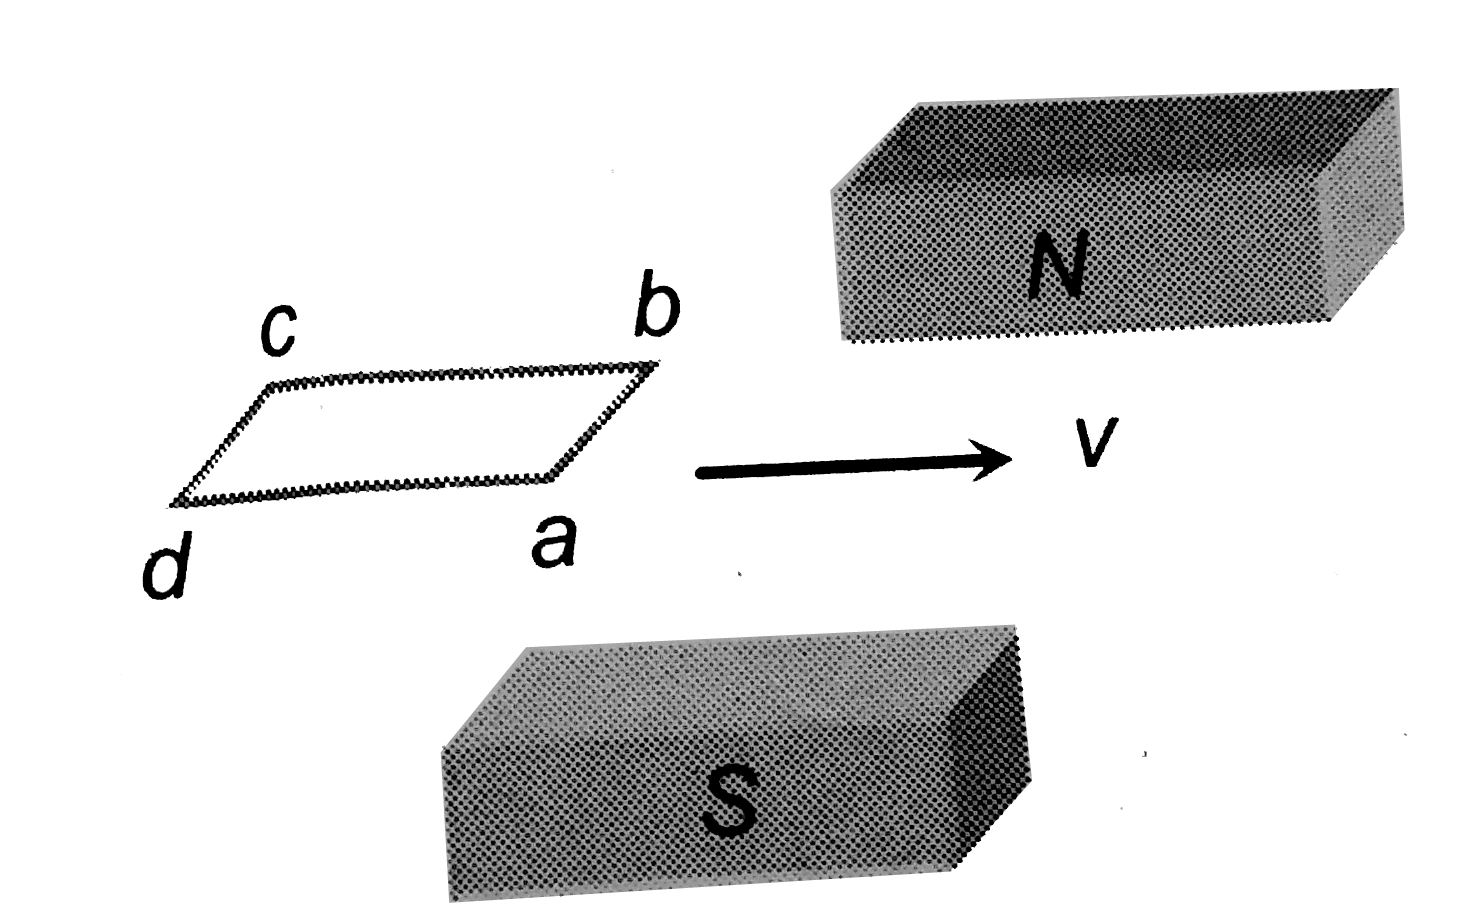
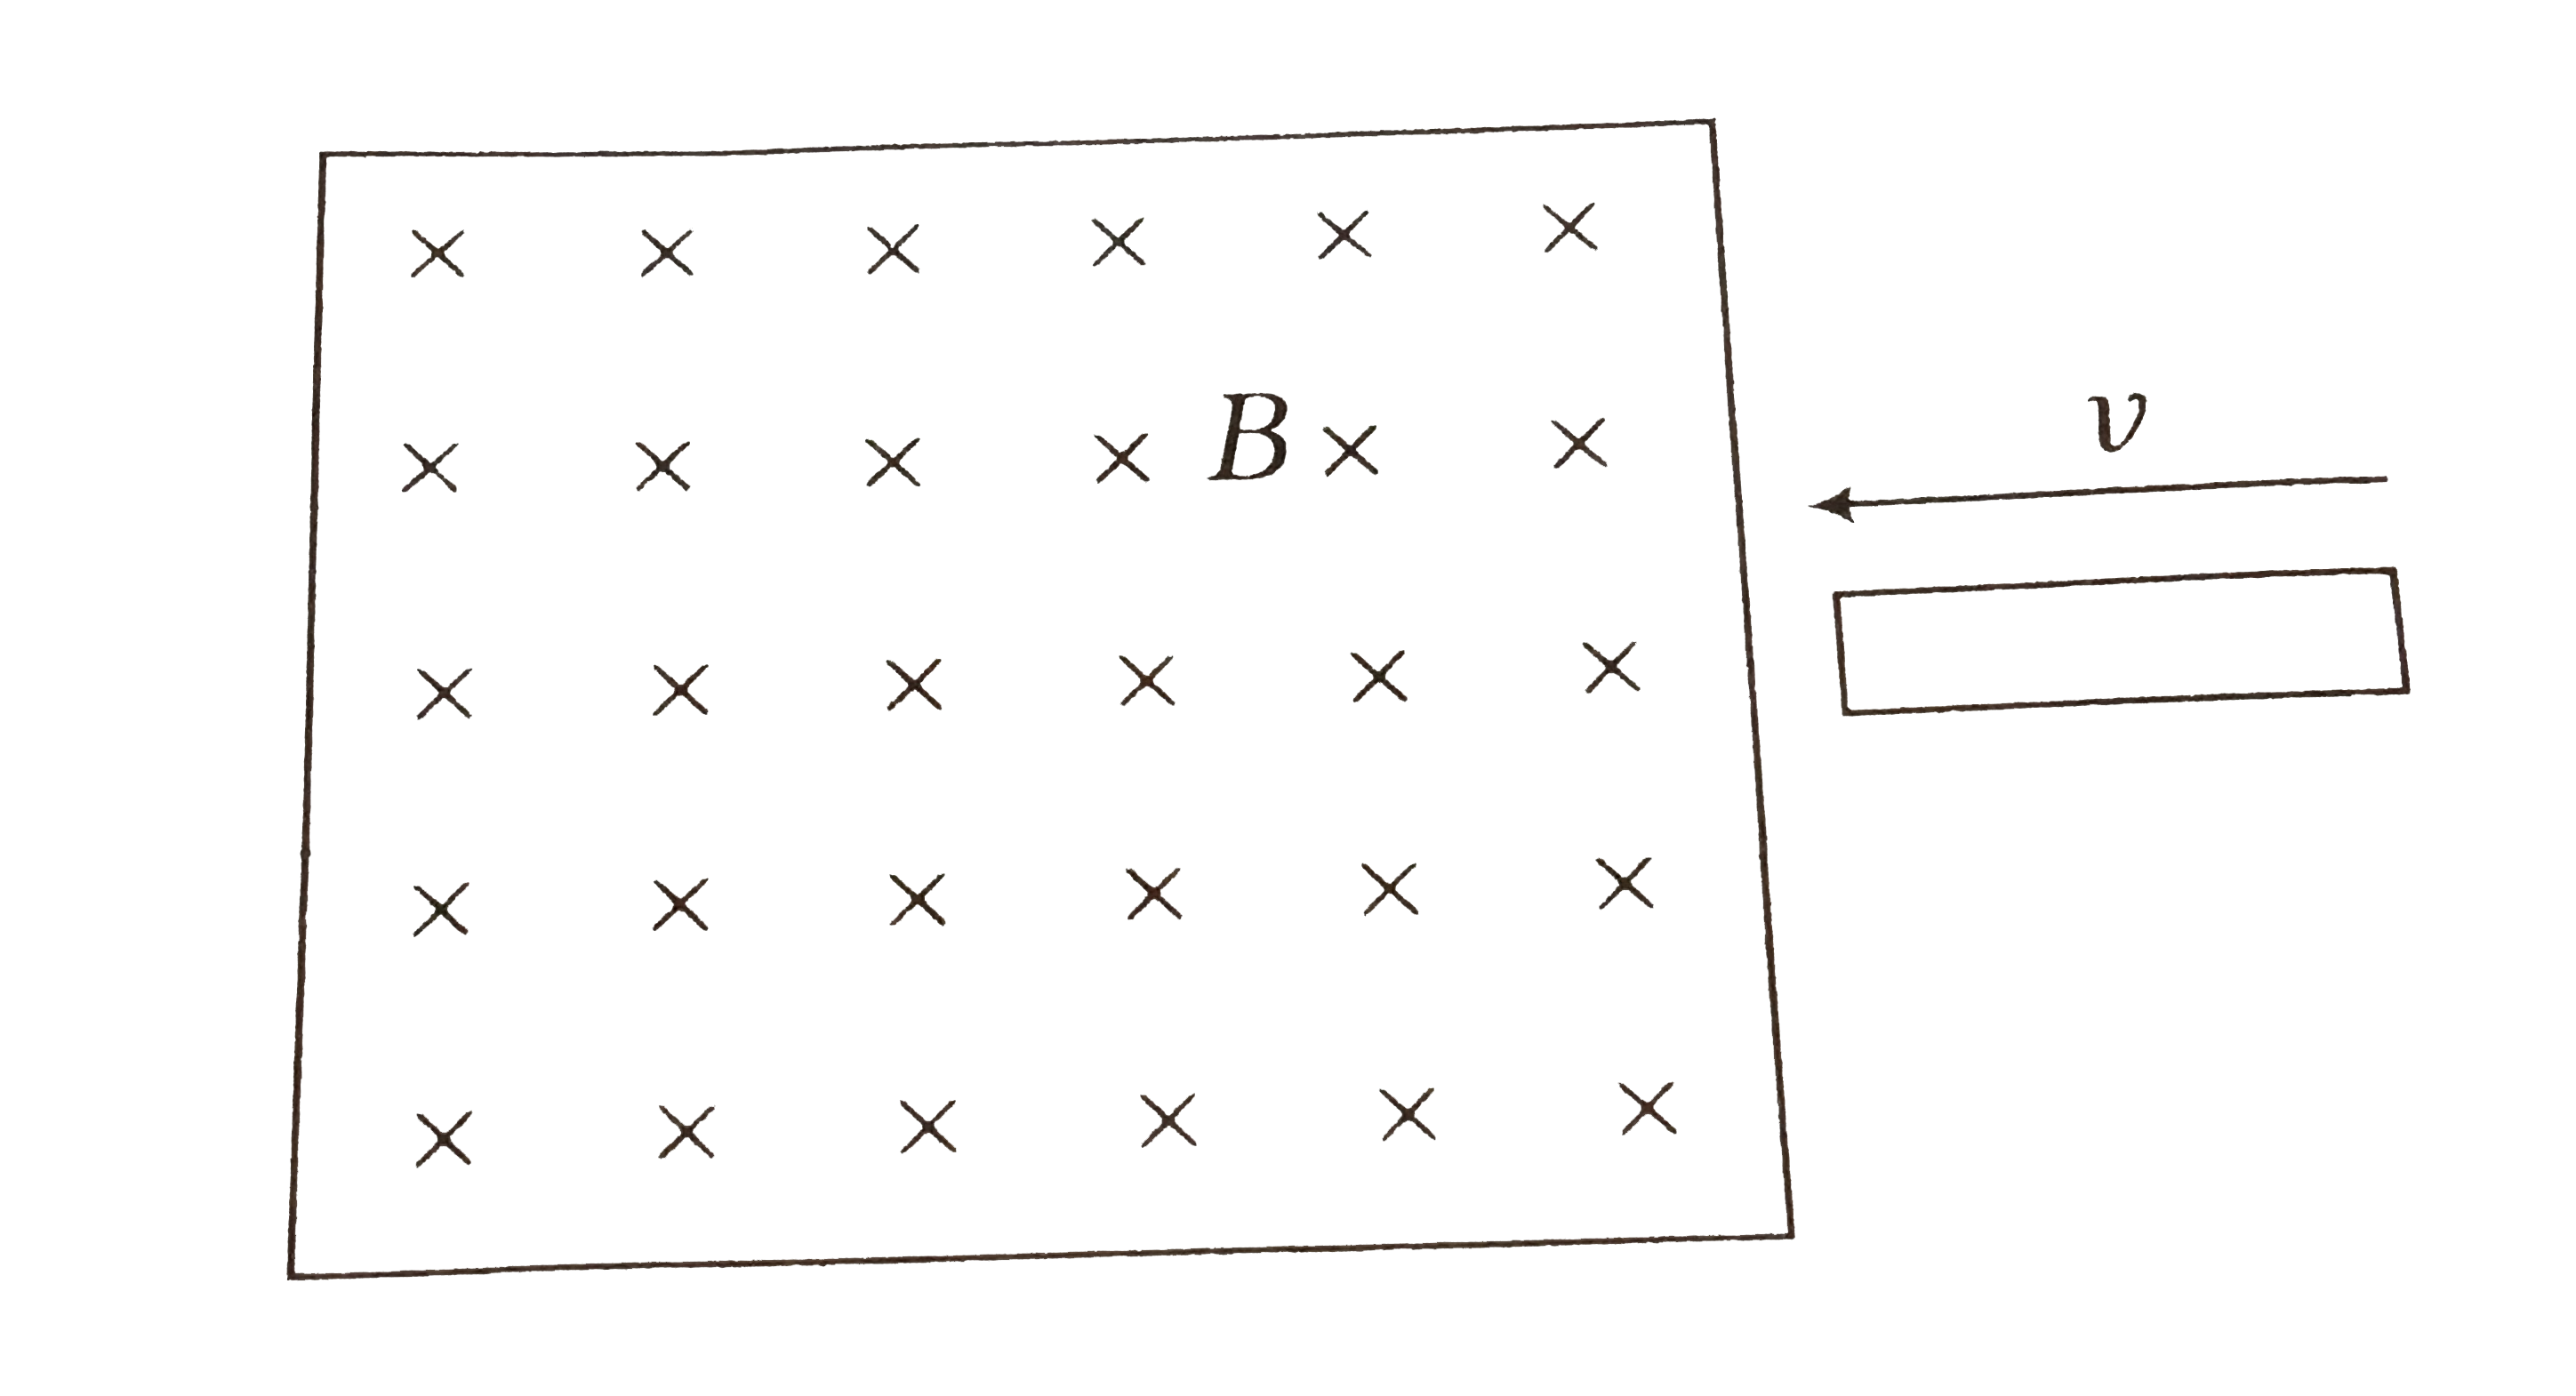
A horizontal loop abcd is moved across the pole piece of a magnet as shown in the figure. With a constant speed v. When the edge ab of the loop enters the pole pieces at time t=0 sec. Which one of the following graphs presents correctly the induced emf in the coil?


The correct Answer is:D
Related Playlists
- BOOK - CENGAGE PHYSICSCHAPTER - ELECTROMAGNETIC INDUCTIONEXERCISE - Multiple correct Answer Type3videos
ELECTROMAGNETIC INDUCTION
- BOOK - CENGAGE PHYSICSCHAPTER - ELECTROMAGNETIC INDUCTIONEXERCISE - single correct10videos
ELECTROMAGNETIC INDUCTION
- BOOK - CENGAGE PHYSICSCHAPTER - ELECTROMAGNETIC INDUCTIONEXERCISE - Archives Asserton - Reasoning1videos
ELECTROMAGNETIC INDUCTION
- BOOK - CENGAGE PHYSICSCHAPTER - ELECTROMAGENTIC INDUCTIONEXERCISE - QUESTION BANK40videos
ELECTROMAGENTIC INDUCTION
- BOOK - CENGAGE PHYSICSCHAPTER - ELECTRON,PHONTS,PHOTOELECTRIC EFFECT & X-RAYSEXERCISE - dpp 3.315videos
ELECTRON,PHONTS,PHOTOELECTRIC EFFECT & X-RAYS
Similar Practice Problems
- Question 1 - Select One
A loop abcd is moved across the pole pieces of a magnet as shown in fig. with a constant speed v. When the edge ab of the loop enters the pole pieces at time t=0 sec. which one of the following graphs represents correctly the induced e.m.f. in the coil if magnetic field lines pass through the loop if it is in between two magnets?
 A
A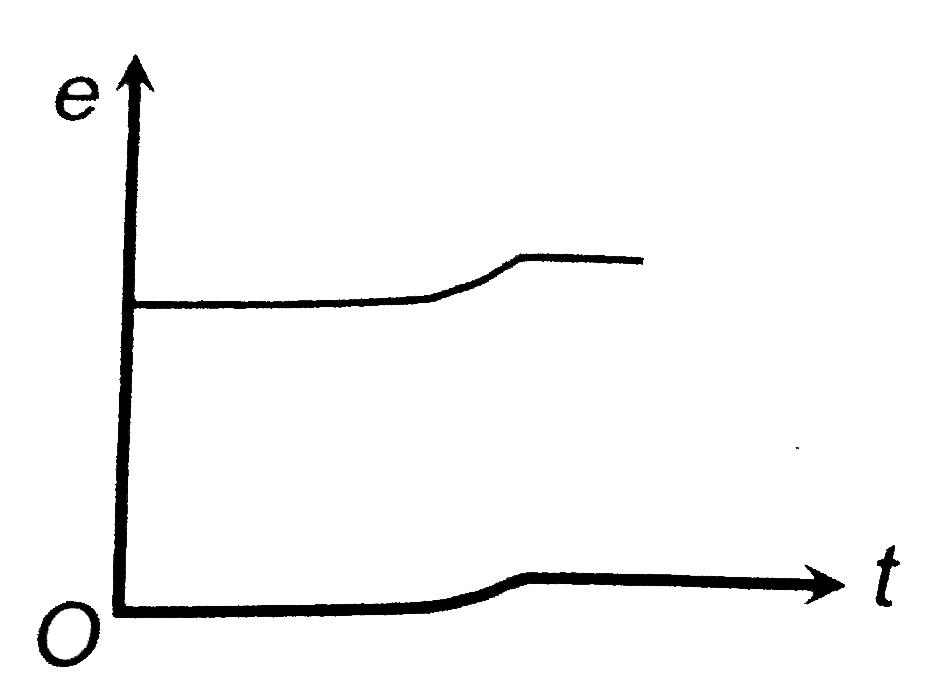 B
B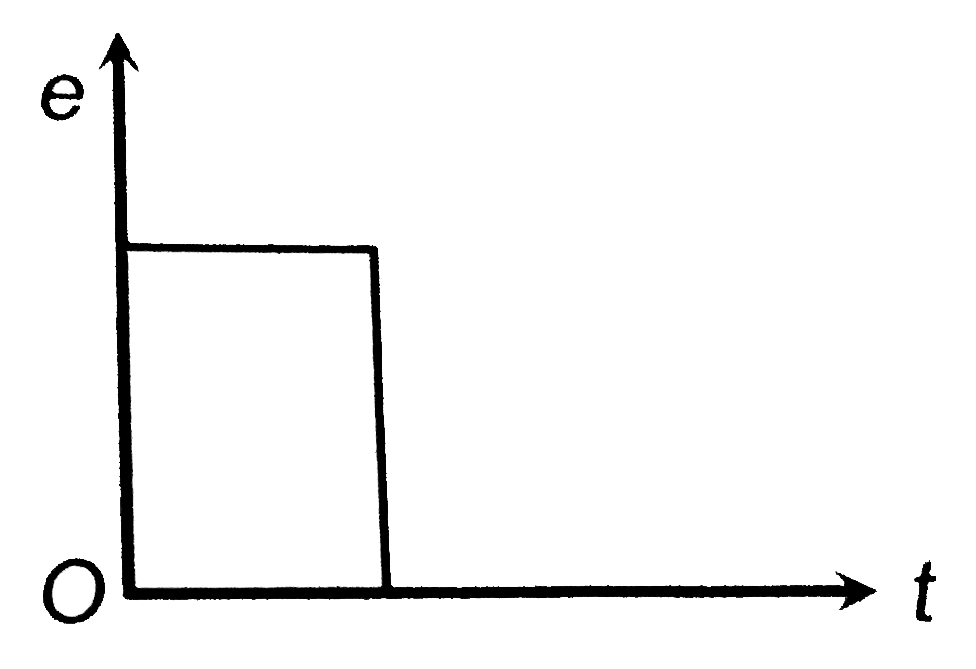 C
C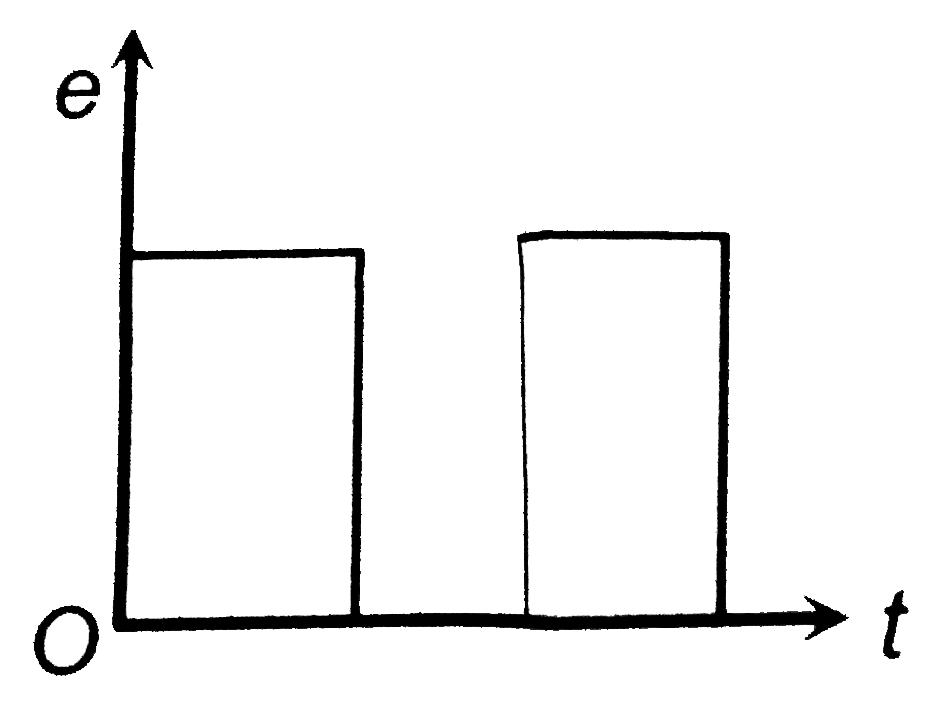 D
D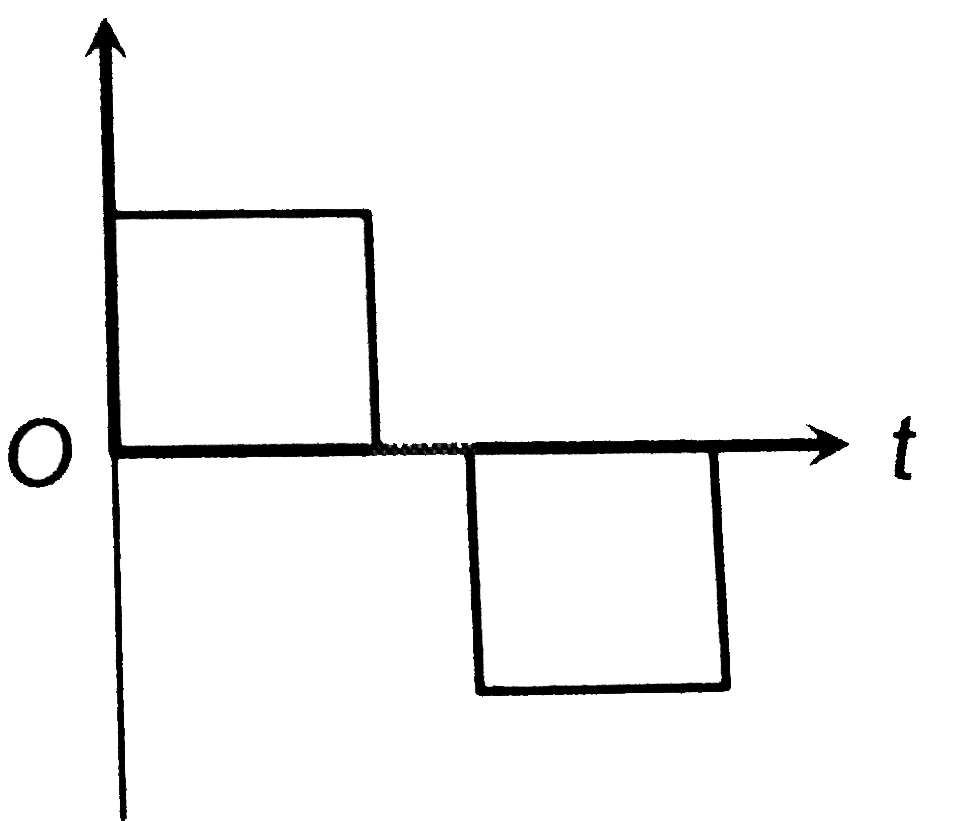
- Question 1 - Select One
A rectangular loop, in edge view, as shown in the following figure, is rotating in a horizontal magnetic field. The axis of rotation is perpendicular to the page and is shown by a black dot in the middle of the figure. The parts of the loop perpendicular to the page are moving at a velocity v as shown in the figure. At the instant depicted, the normal to the loop makes an angle of 30° with the east direction. Which of the following statements, about the magnetic flux ϕ through the loop and the induced emf in the loop, are true, at the instant depicted?
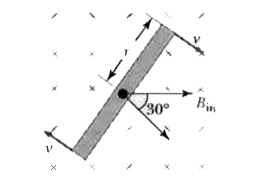 Aϕ is increasing and emf is increasingBϕ is increasing and emf is decreasingCϕ is decreasing and emf is increasingDϕ and emf are both zero
 - Question 1 - Select One
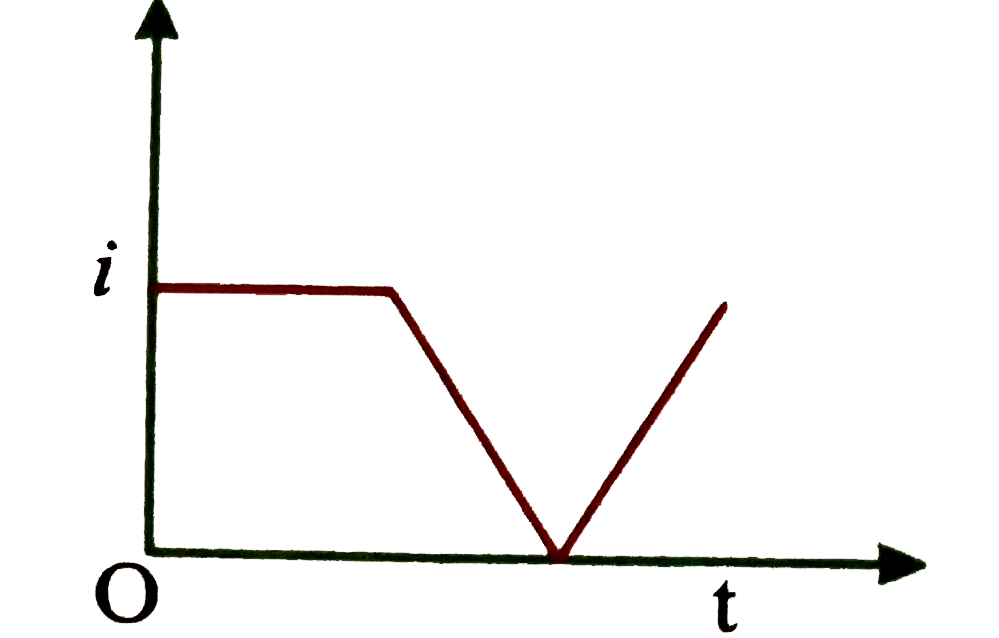
The current is an induction coil varies with time t, according to the graph shown in figure. Which of the following graphs shows the induced emf (e) in the coil with time.
 A
A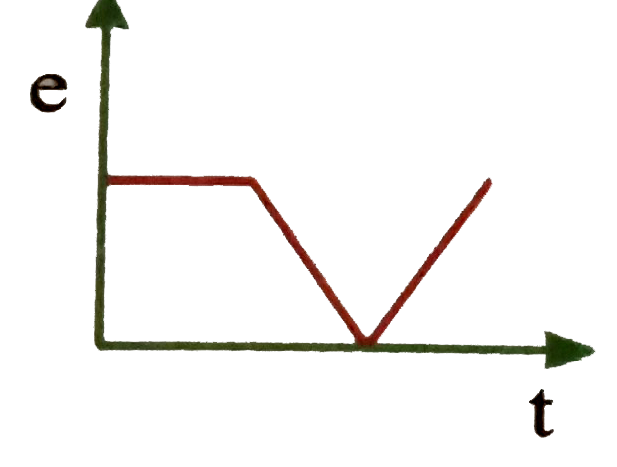 B
B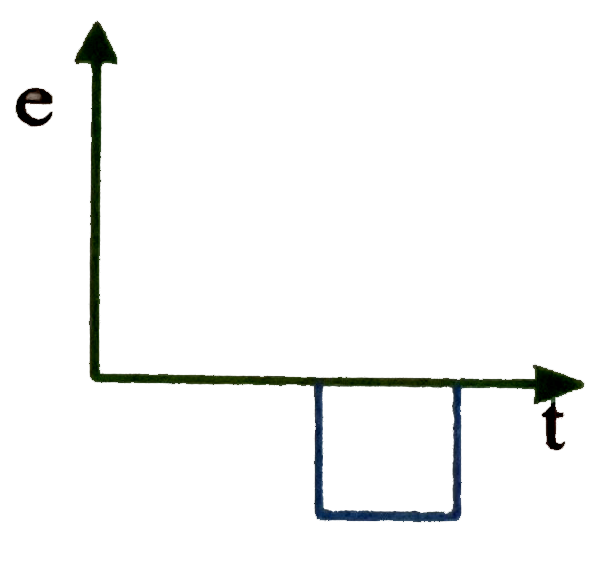 C
C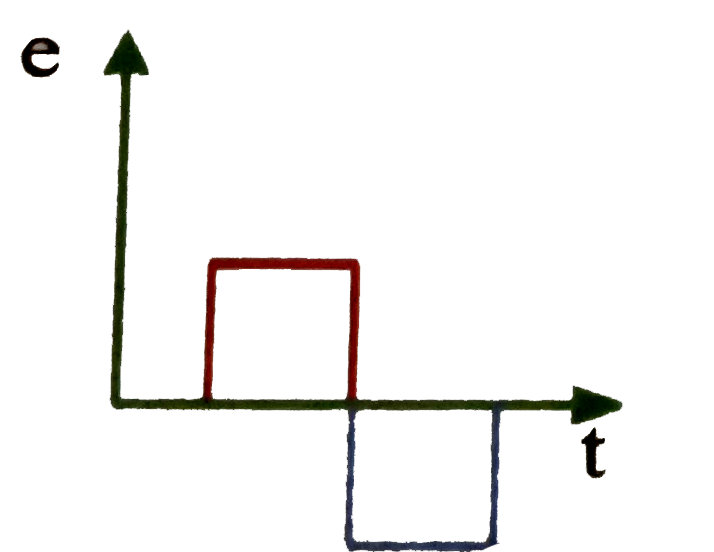 D
D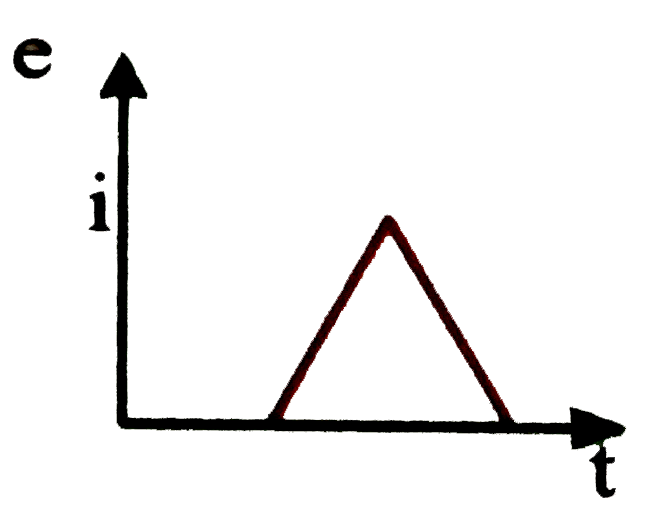
- Question 1 - Select One
The current i in an induction coil varies with time according to the graph shown in figure. Which of the following graph shows induced emf in the coil with time:
A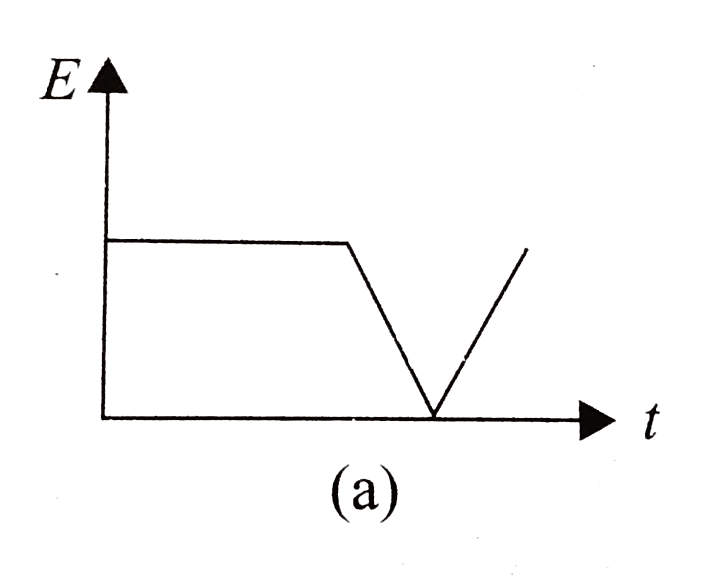 B
B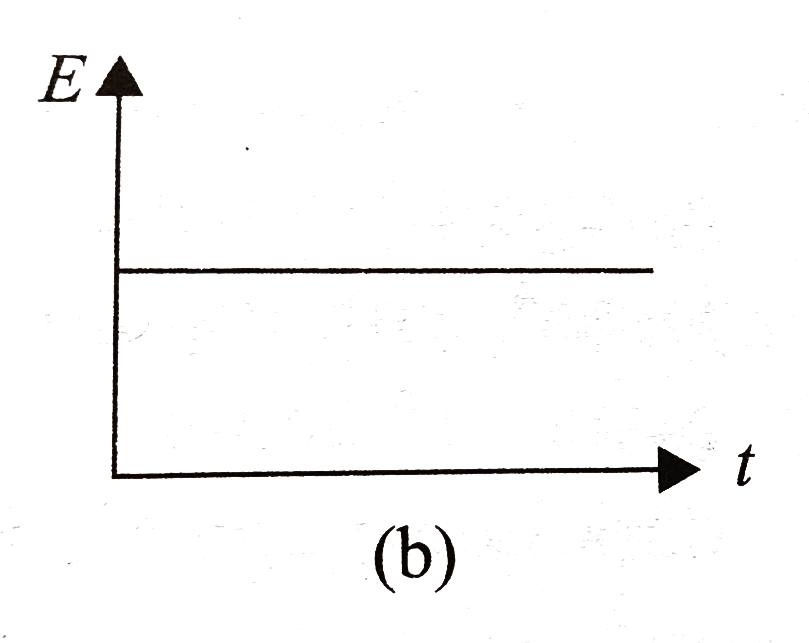 C
C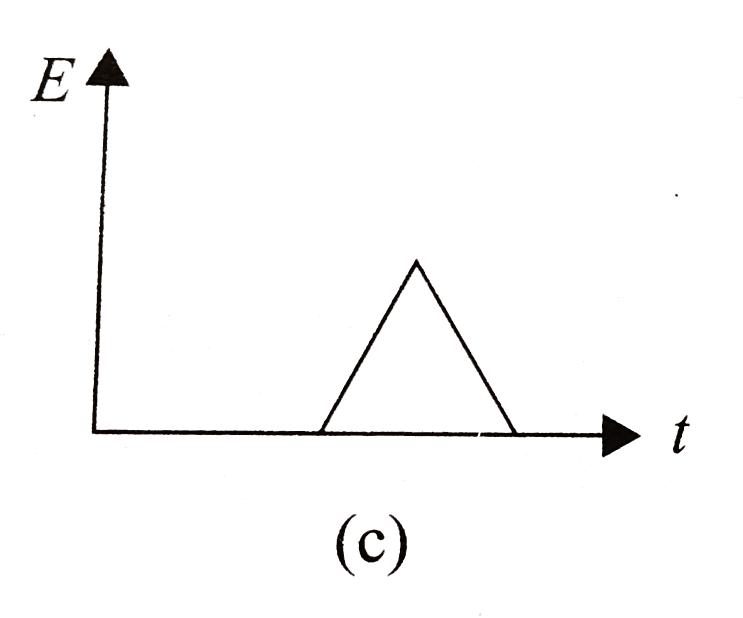 D
D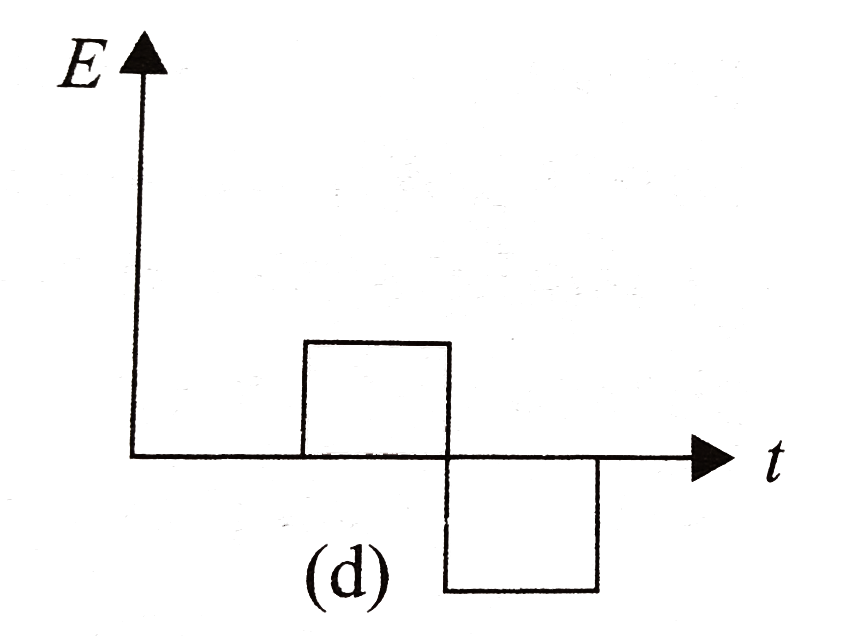
- Question 1 - Select One
In the following figure, the magnet is moved towards the coil with a speed v and induced emf is e. if magnet and coil reced away from one another each moving with speed v, the induced emf in the coil will be
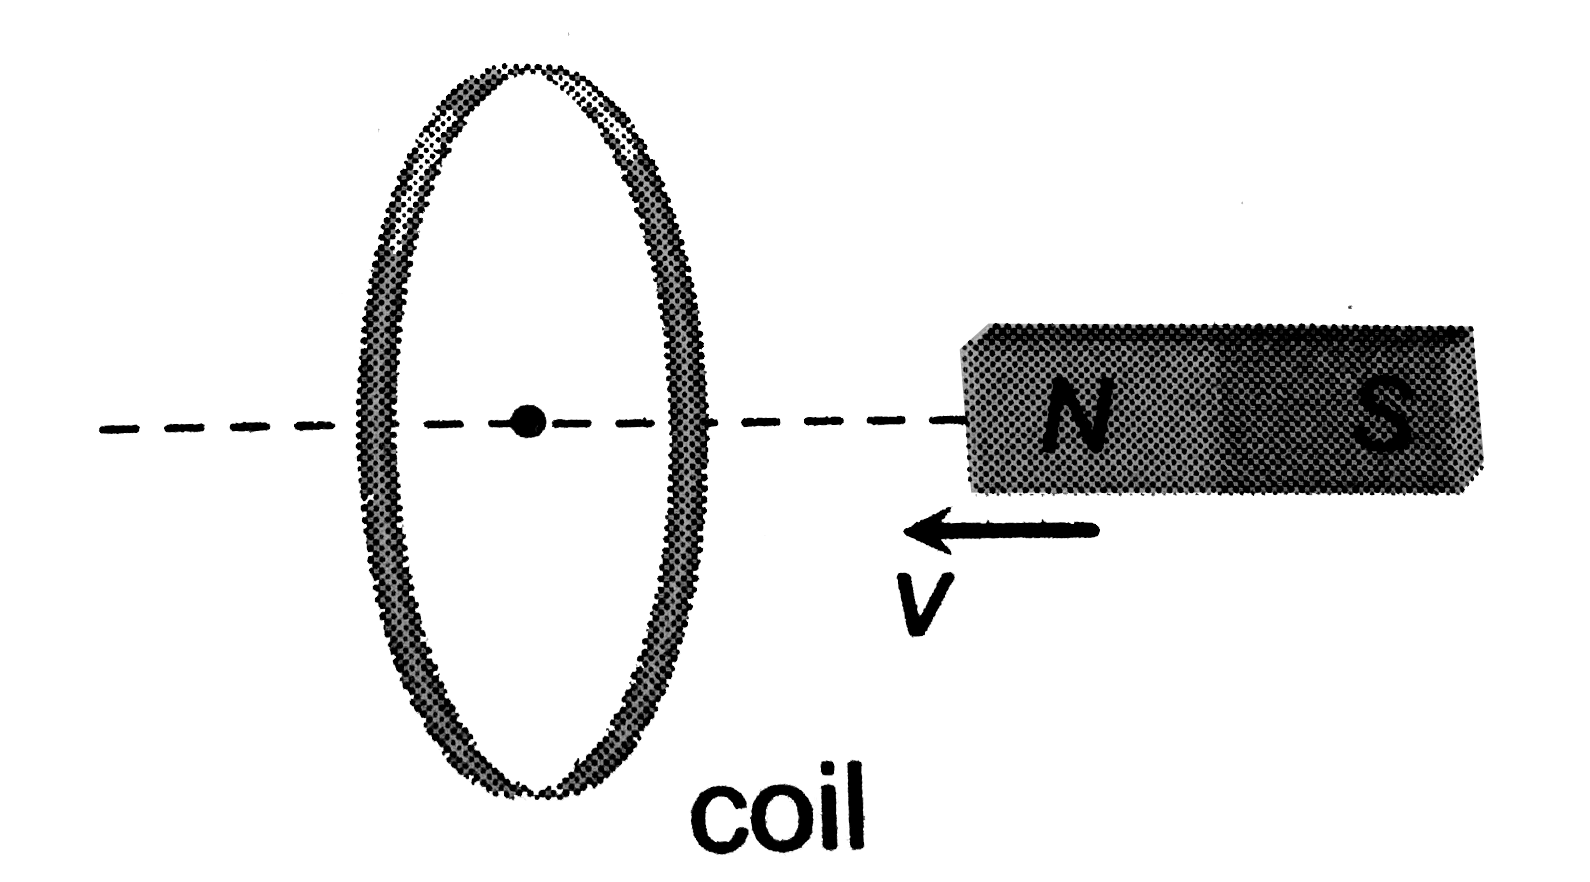 AeB2eCe/2D4e
 - Question 1 - Select One
A semicircle loop PQ of radius 'R' is moved with velocity 'v' in transverse magnetic field as shown in figure . The value of induced emf . Between the ends of loop is :-
 ABv (πr), 'P' at high potentialB2 BRv, end P at high potentialC2 BRv, end Q at high potentialDBπR22v, end P at high potential
Similar Questions
The current i in an induction coil varies with time according to the graph shown in figure. Which of the following graph shows induced emf in the coil with time:
View SolutionFigure shown a square loop of side l being moved towards right at a constant speed v . The front edge enters th emagnetic field B at t=0 . The width of field is 3l . Sketch induced emf versus time graph.
 View Solution
Through a uniform B field, A small rectangular loop is moving towards left with constant velocity as shown in the figure. Counting of time t begins at the moment, the loop starts entering the field.
Plot the variation of flux through the loop with respect to time. Also, plot the variation of induced emf w.r.t. time t.
 View Solution

