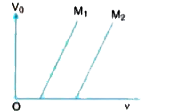
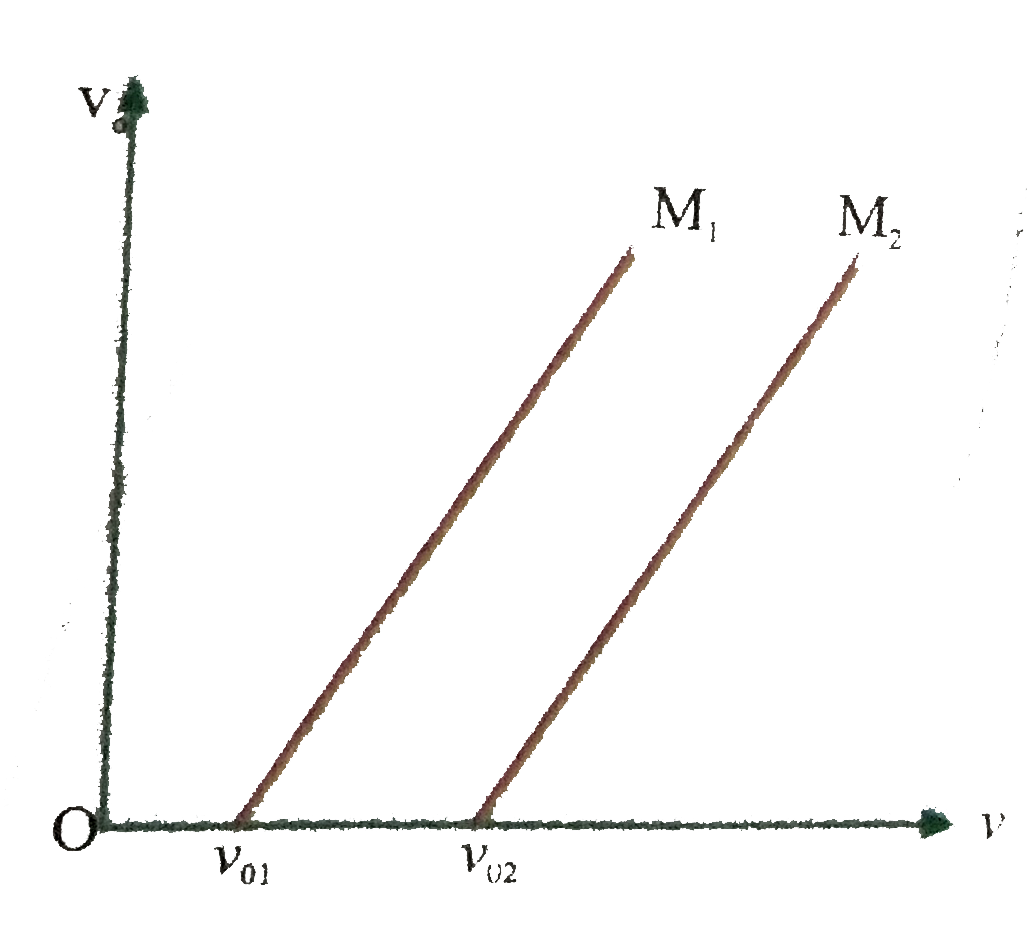
The variation of the stopping potential (V0) with the frequency (v) of the light incident on two different photosensitive surfaces M1andM2 is shown in the figure. Identify the surfaces which has greater value of the work function. 
The correct Answer is:My will have a greater value of the work function because its threshold frequency is more.
Similar Practice Problems
- Question 1 - Select One
Figure show the variation of the stopping potential (V0) with the frequency (v) of the incident radiations for two different photosensitive matererial M1 and M2 What are the values of work functions for M1 and M2 respectively
 Ahv01,hv02Bhv02,hv01Chv01,hv01Dhv02,hv02
 - Question 1 - Select One
The stopping potential as a function of the frequency of the incident radiation is plotted for two different photoelectric surfaces A and B . The graphs show that work function of A is
 AlessBmoreCequalDnothing can be said
 - Question 1 - Select One
The stopping potential as a function of the frequency of the incident radiation is plotted for two different photoelectric surfaces A and B . The graphs show that work function of A is
 AGreater than that of BBSmaller than that of BCEqual to that of BDNo inference can be drawn about their work functions from the given graphs
 - Question 1 - Select One
The stopping potential as a function of the frequency of the incident radiation is plotted for two different photoelectric surfaces A and B . The graphs show that work function of A is
 AGreater than that of BBSmaller than that of BCSame as that of BDNo comparison can be done from given graphs
Similar Questions
The stopping potential (v0) varies linearly with the frequency (v)of the incident radiation for a given photosensitive surface with the slope remaining the same for different surface . Given reason.
View SolutionExplain giving reasons for the following:
(a) Photoelectric current in a photocell increases with the increase in the intensity of the incident radiation.
(b) The stopping potential (V0) varies linearly with the frequency (v) of the incident radiation for a given photosensitive surface with the slope remaining the same for different surfaces.
(c) Maximum kinetic energy of the photoelectrons is independent of the intensity of incident radiation.View SolutionExplain giving reasons for the following :
(a) Photoelectric current in a photocell increases with the increase in intensity of the incident radiation.
(b) The stopping potential V0 varies linearly with the frequency ν of the incident radiation for a given photosensitive surface with the slope remaining the same for different surfaces.
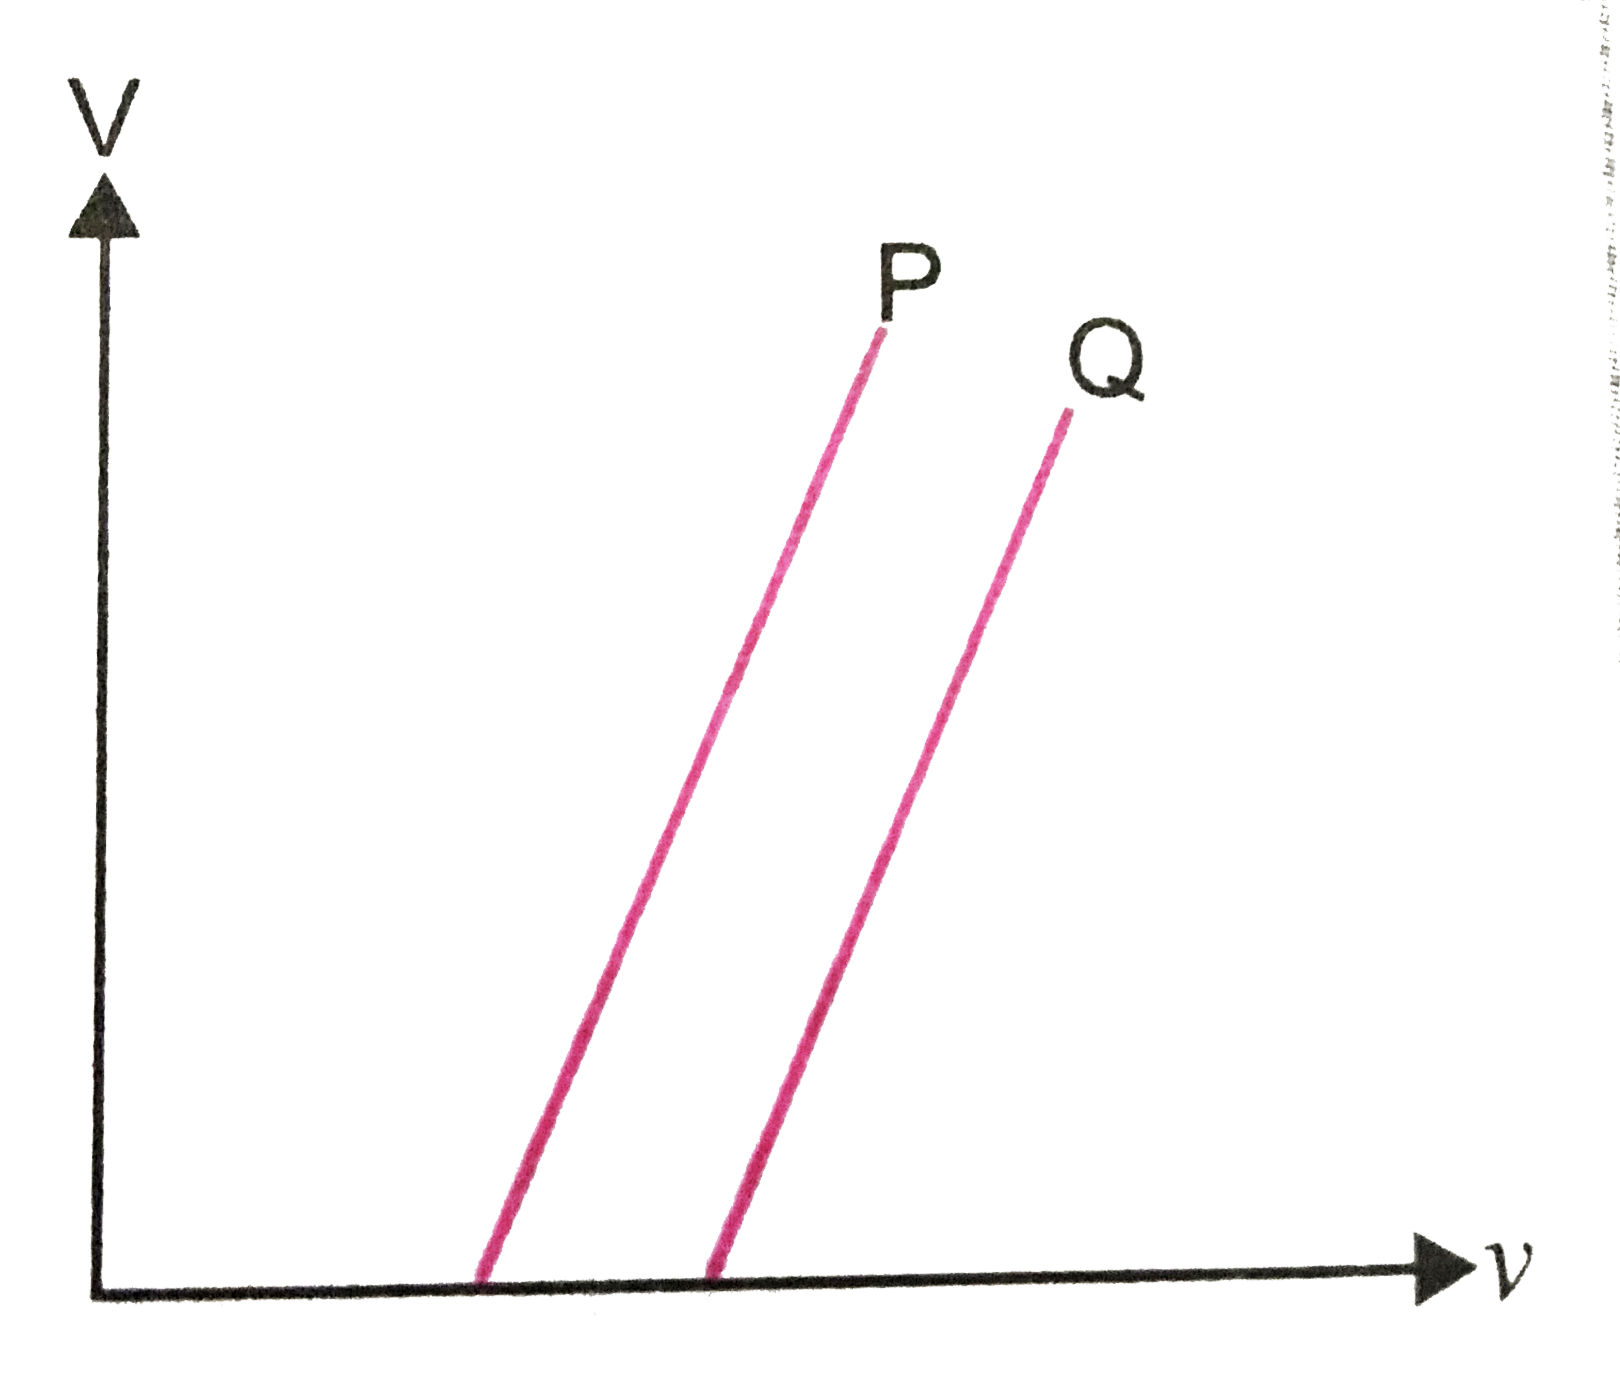
(c) Maximum kinetic energy of the photoelectrons is independent of the intensity of incident radiation.View SolutionThe figure shows the variation of stopping potential VQ with the frequency v of the incident radiations for two photosensitive metals P and
Which metal has smaller threshold wavelength ? Justify your answer.View SolutionIn a photoelectric effect experiment, the graph between the stopping potential (V) and frequency (v) of the incident radiations on two different metal plates P and Q are shown in plates, P and Q has greater value of work function ? (ii) What does the slope of the lines depict?
 View Solution
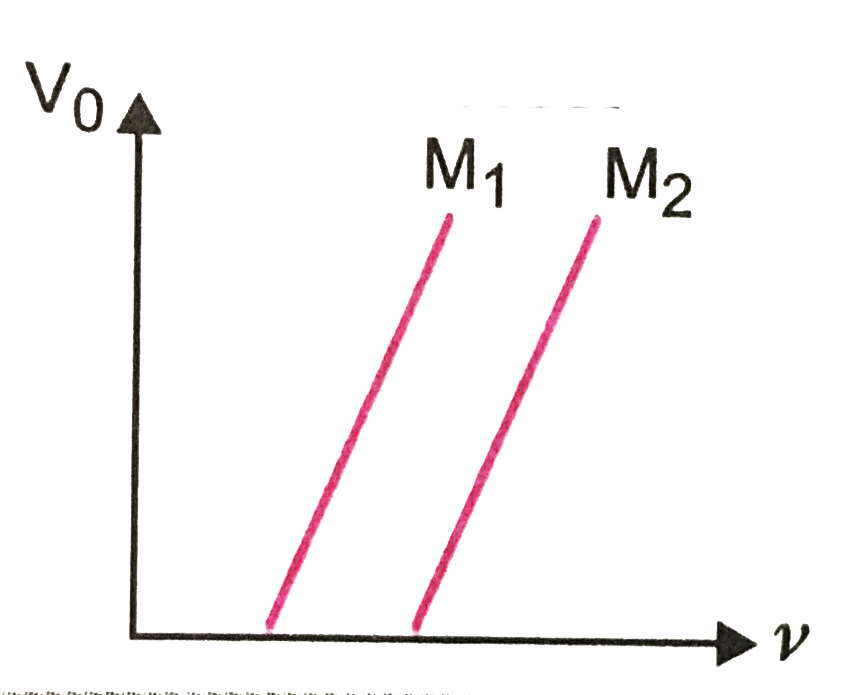
fig. shows variation of stopping potential (V0) with frequency (v) for two photosenstive matrials M1andM2.

(i) why is the slope same for both lines?
(ii) For which material will the emitted electrons have greater kinetic energy for the incident radiations of the same frequency? Justify your answer.View Solution

