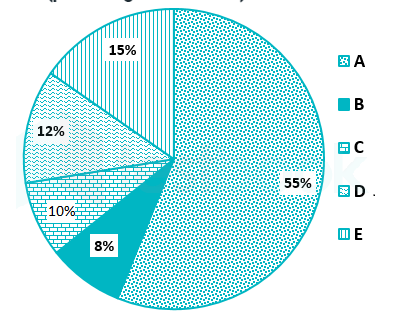
The following pie chart gives he distribution of funds in a five year plan under the major heads of development expenditures:
Agriculture (A), Industry (B), Education (C), Employment (D) and Miscellaneous (E)
The total allocation is 36,000 (in crores of rupees).
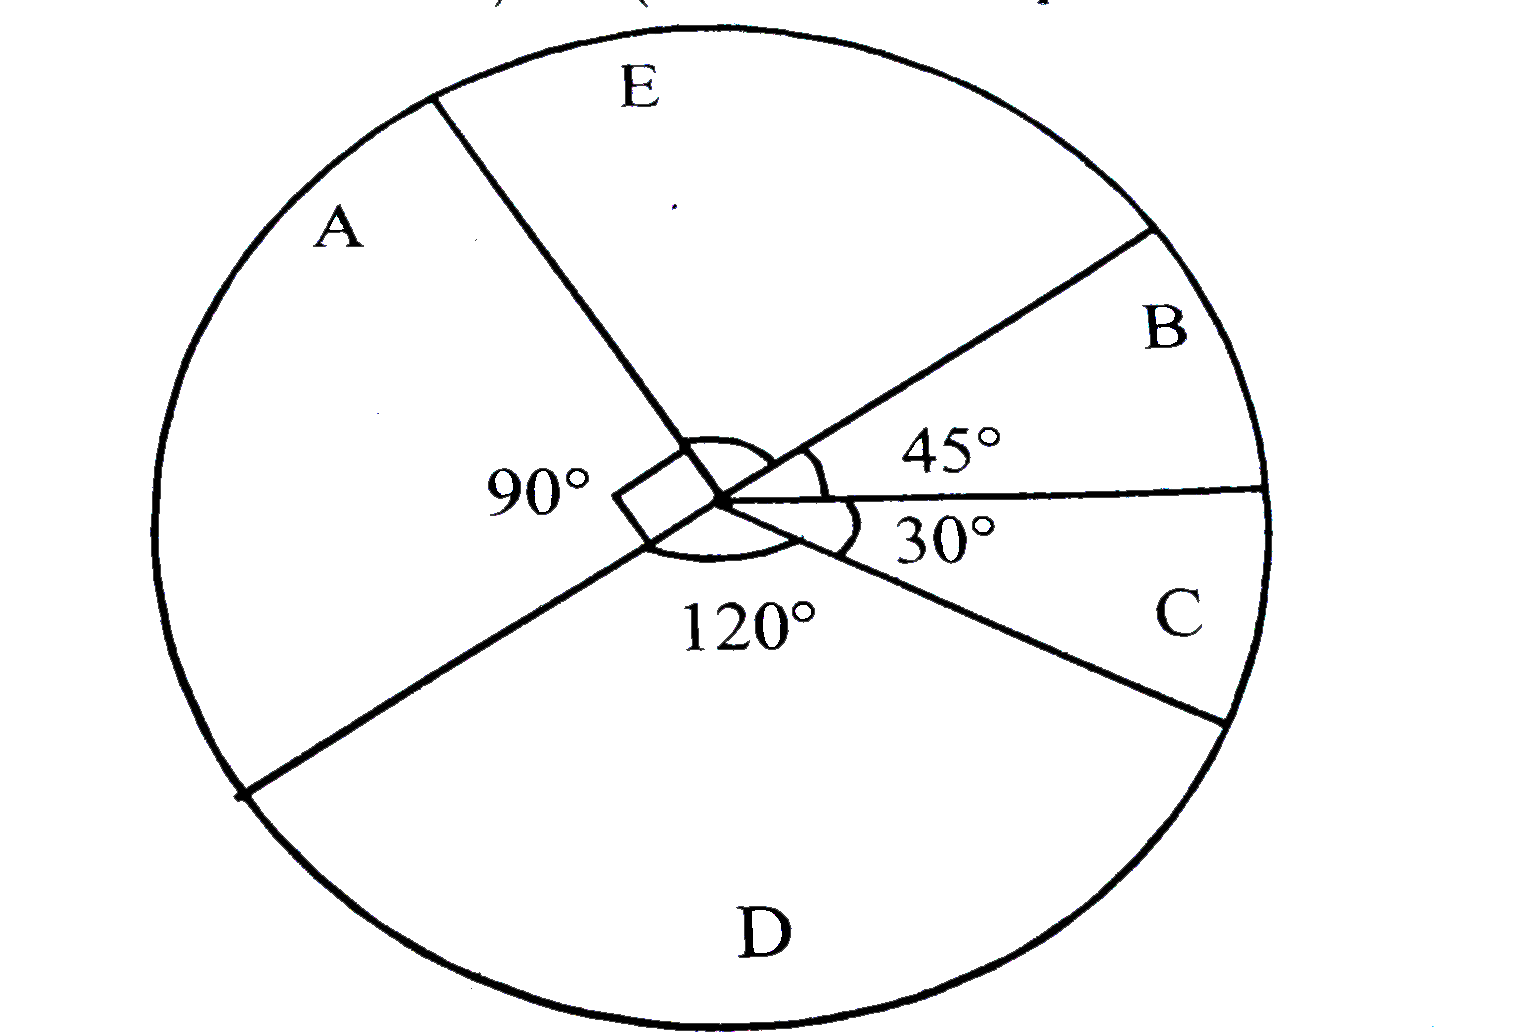
Which head is allocated maximum funds ?
Agriculature
Industry
Employment
Miscellaneous
The correct Answer is:C
Agriculture: 90360×36000=9000
Miscellaneous :75360=7500
Industry : 45360×36000=4500
Education : 3000 Employment : 12000
Hence, Employment is allocated maximum funds.
Related Playlists
- BOOK - NDA PREVIOUS YEARSCHAPTER - SETS, RELATIONS, FUNCTIONS AND NUMBER SYSTEM EXERCISE - MCQ271videos
SETS, RELATIONS, FUNCTIONS AND NUMBER SYSTEM
- BOOK - NDA PREVIOUS YEARSCHAPTER - TRIGONOMETRY - RATIO & IDENTITY , TRIGONOMETRIC EQUATIONSEXERCISE - MCQ238videos
TRIGONOMETRY - RATIO & IDENTITY , TRIGONOMETRIC EQUATIONS
Similar Practice Problems
- Question 1 - Select One
The following pie-chart and table show the percentage distribution of farmers in 5 states A, B, C, D & E of a country who claimed insurance due to drought in the year 2017 and ratio of males to females of the number of farmers in states, respectively. Study the pie-chart and the table carefully and answer the following questions.
Note: Some data are missing in the pie-chart and table, if required in any question, find the missing data first and then answer the question.
Total number of farmers who claimed insurance in the year 2017 = 2,64,000
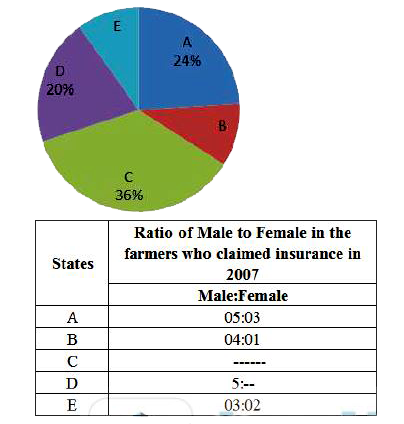
The number of farmers who claimed insurance in state C exceeds the total number of farmers (who claimed insurance)in state E and state A together by 5280. What is the percentage of farmers who claimed insurance in state E?A0.15B0.25C0.1D0.4 - Question 1 - Select One
The pie chart shyows how the school funds is spent under different heads in a certain school. Using the pie chart answer the questions.
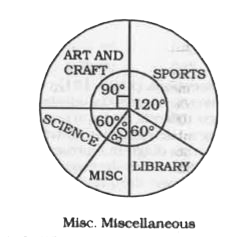
Which head has the maximum expenditure?AArt and CraftBSportsCLibraryDScience - Question 1 - Select One
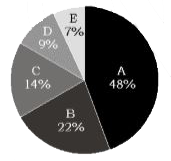
The given pie-chart represents the distribution of the percentage of sales of a particular brand of car from five showrooms A, B, C, D and E during 2018. The total number of cars sold during that year from the five showrooms is 5000.
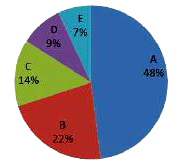
What is the total number of cars sold from the show rooms B and D?A1450B1750C1550D1650 - Question 1 - Select One
Study the given information carefully and answer the following questions. Three yoga masters i.e., A, B, C and D conducted yoga sessions in a society. These yoga sessions are of three types viz. Basic (of 1 hour each), Regular (of 2 hours each) and Advanced (of 3 hours each). The pie chart given below shows the percentage distribution of total number of hours for which the given yoga masters conducted sessions in the society.
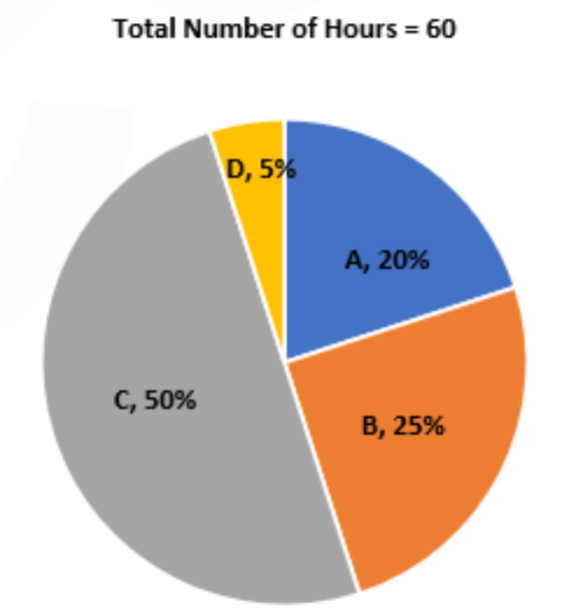
If yoga master C conducted 4 Regular sessions and atleast one session of each type was conducted by him, then find the maximum number of Basic sessions that were conducted by Yoga master CA20B22C19D18
Similar Questions
Study the pie chart given below and answer the question that follow
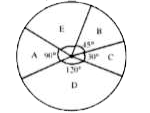
Which heads is allocated maximum funds?View SolutionThe following pie chart depicts the expenditure of a state government under different heads,(if the total spending is 10 crores)

How many times is the amount of money Others spent on education compared to the amount spent on roads?View SolutionThe following pie chart and table show the percentage distribution of farmers in 5 states A B C D E of a country who claimed insurance due to drought in the year 2017 and ratio of males to females to farmers in states, respectively
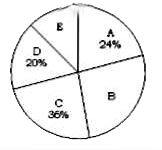
The number of farmers who claimed insurance C exceeds the total number of farmers in state E and state A together by 5280 What is the percentage of farmers who claimed insurance in state.
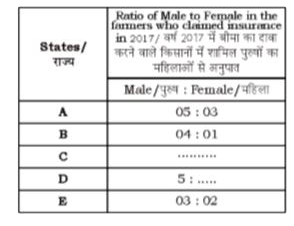 View Solution
(Questions 15-19): The pie-chart shown below gives the distribution of land in a village under various food crops. Study the pie-chart carefully and answer the questions that follow: Distribution of areas (in acres) under various food crops (FIGURE) Which combination of three crops contribute to 50% of the total area under the food crops? (a) Wheat, Barley and Jowar (b) Rice, Wheat and Jowar (c) Rice, What and Barley (d) Bajra, Maize and Rice
View SolutionStudy the following pie-chart and answer the given question.
The pie-chart shows the Budget Expenditure of a company in the year 2018 (percentage distribution) on different heads AB.C,D & E.
The central angle of the sector representing expenditure on head E is:
View SolutionThe given pie chart represents the distribution of the percentage of sales of a particular brand of car from five showrooms A B C D and E during 2018 The total number of cars sold during that year from the five showsrooms in 5000.
What is the total number of cars sold from the showrooms B and D?View Solution

