The table given below shows the population literate and illiterate in thousand and percentage of literacy in three states in a year -----

After reading the table,mark a tick against the correct answer in each question given below and hence complete the table -----
Literates in Bengal are ------
A
50599
B
9715
C
7865
D
9475
Video Solution
Text Solution
The correct Answer is:B
|
Answer
Step by step video, text & image solution for The table given below shows the population literate and illiterate in thousand and percentage of literacy in three states in a year ----- After reading the table,mark a tick against the correct answer in each question given below and hence complete the table ----- Literates in Bengal are ------ by Maths experts to help you in doubts & scoring excellent marks in Class 14 exams.
Updated on:21/07/2023
Related Playlists
Similar Practice Problems
- Question 1 - Select One
The table given below shows the population literate and illiterate in thousand and percentage of literacy in three states in a year -----

After reading the table,mark a tick against the correct answer in each question given below and hence complete the table -----
Percentage of Literacy in Chennai is ------A14.9%B13.01%C12.61%D15.64% - Question 1 - Select One
The table given below shows the population literate and illiterate in thousand and percentage of literacy in three states in a year -----

After reading the table,mark a tick against the correct answer in each question given below and hence complete the table -----
Percentage of Literacy in Mumbai is------A19.5%B16.7%C18.3%D14.6% - Question 1 - Select One
Following table gives the population of a from 1998 to 1992
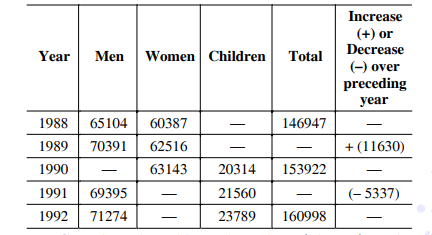
Complete the table and mark a tick against the correct answer in the question ------A31236B125491C14546D21456 - Question 1 - Select One
The following table gives the plan outlay for 1987-88 for
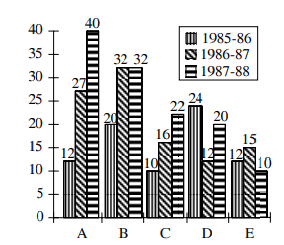
Study the table and mark a tick (sqrt) against the correct answer in each questions given below-
The total plan outlay for A and C is in the ratio-A19:50B101:25C3:2D65:16 - Question 1 - Select One
The following table gives the plan outlay for 1987-88 for
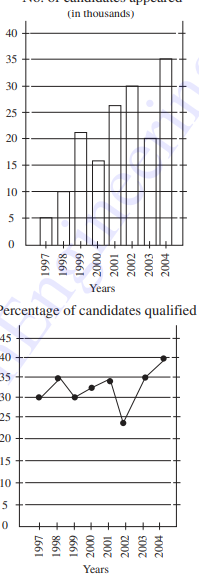
Study the table and mark a tick (sqrt) against the correct answer in each questions given below-
Which area received minimum consideration in State A?AIrrigation and Flood controlBCommunicationCSocial ServicesDRural Development - Question 1 - Select One
The following table shows the production of foodgrains in million tonnes in a state for the period from 1988-89 to 1992-93 -----
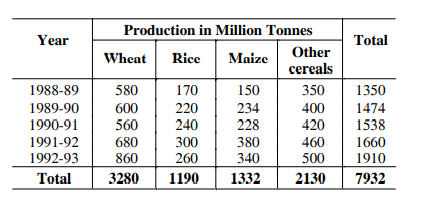
Read the above table and mark a tick against the correct answer in each of the following question -----
During the year 1992-93 the percentage increase in production of wheat over the previous year was ----A26.4%B20.9%C23.6%D18.7% - Question 1 - Select One
The following table shows the production of foodgrains in million tonnes in a state for the period from 1988-89 to 1992-93 -----
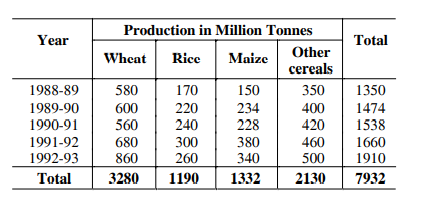
Read the above table and mark a tick against the correct answer in each of the following question -----
In the year 1990-91 , the percentage of decrease in production of maize was ----A2.63%B2.56%C2.71%D2.47% - Question 1 - Select One
The following table shows the production of foodgrains in million tonnes in a state for the period from 1988-89 to 1992-93 -----
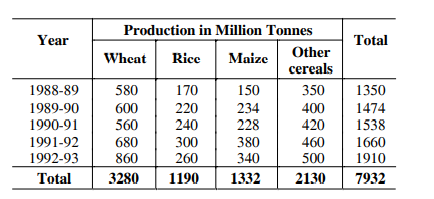
Read the above table and mark a tick against the correct answer in each of the following question -----
During the year 1991-92, the percentage in increase production was maximum for -----AwheatBRiceCMaizeDother cereals - Question 1 - Select One
The following table shows the production of foodgrains in million tonnes in a state for the period from 1988-89 to 1992-93 -----
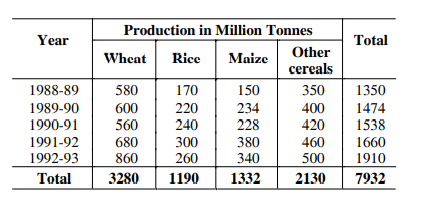
Read the above table and mark a tick against the correct answer in each of the following question -----
During the period from 1988-89 to 1992-93 , what percent of the total production is the wheat ?A42.6%B43.1%C41.3%D40.8% - Question 1 - Select One
The table given below shows number of literate people and total population in a village from the year 2011 to 2016.

What is the percentage of people who are literate in 2012?A26.49B27.92C29.14D22.74

