Load - elongation graph for two wires of same material is as shown in the figure. If their lengths are same which of the two wires A and B is thina 2b 1c both are of same radiusd none
Correct option a 2Explanation :
Related Solutions
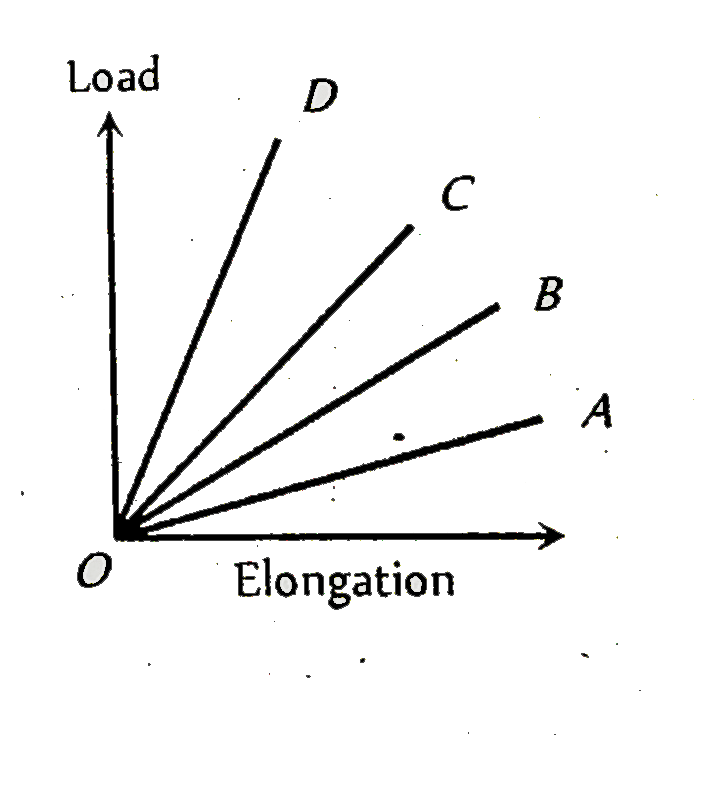
The load versus elongation graph for four wires of the same material and same length is shown in the figure. The hinnest wire is represented by the line
View SolutionThe load versus elongation graph for four wires of the same material and same length is shown in the figure. The hinnest wire is represented by the line
View SolutionThe load versus elongation graph for four wires of the same material and same length is shown in the figure. The hinnest wire is represented by the line
View SolutionThe load versus elongation graph of four wires of same length and the same material as shown in the figure. The thinest wire is represented by the line
View SolutionLoad-elongation graphs of two wires A and B, made of the same material and of equal initial length are shown in the fig.1.21. Which wire is thicker?
View SolutionThe load verses elongation graph for four wires of the same material is shown in figure which of the wire is thickest
View SolutionThe load verses elongation graph for four wires of the same material is shown in figure which of the wire is thickest
View SolutionThe load versus elongation graph for four wires of the same material is shown in the figure. The thickest wire is represented by
 View Solution
The load versus elongation graph for four wires of the same material is shown in the figure. The thickest wire is represented by the line
 View Solution
The load versus elongation graph for four wires of the same material is shown in the figure. The thickest wire is represented by
 View Solution
In fig.1.21 load-elongation of two wires made of two different materials A and B are shown. The wires have the same length and the same area of cross section. Which material has a greater value of Y?
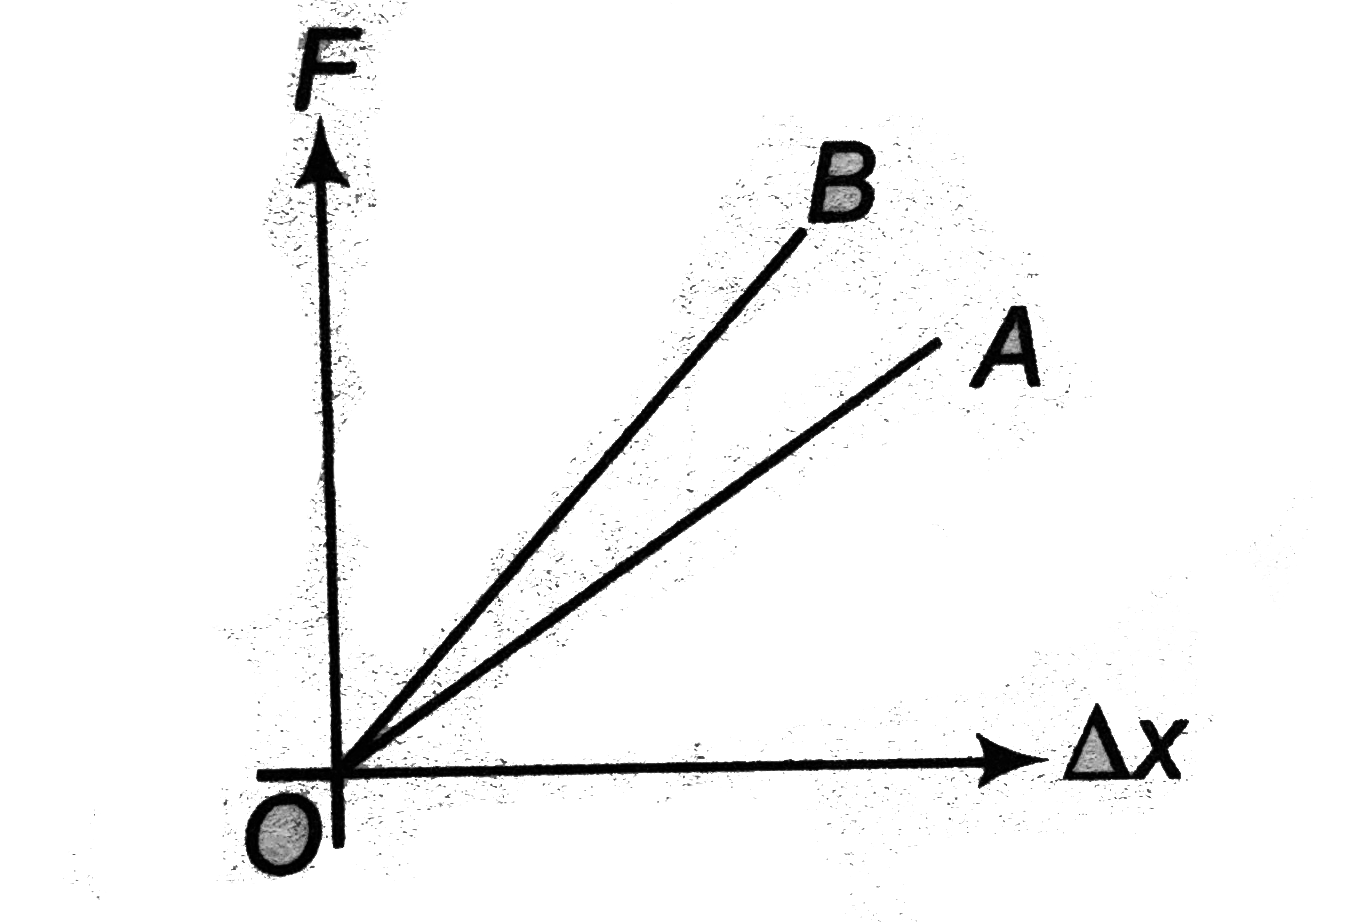
View SolutionTwo wires and of same length are made of same material . The figure represents the load versus extension graph for the wires. Then
 View Solution
Two wires A and B of same length are made of same material . The figure represents the load F versus extension Deltax graph for the wires. Then
View SolutionTwo wires A and B have the same cross section and are made of the same material, but the length of wire A is twice that of B. Then, for a given load
View SolutionTwo wires A and B have the same cross section and are made of the same material but the length of wire A is twice that of B. Then for a given load
View SolutionTwo wires A and B have the same cross section and are made of the same material, but the length of wire A is twice that of B . Then, for a given load
View SolutionTwo wires and have the same cross section and are made of the same material, but the length of wire is twice that of . Then, for a given load
View SolutionThree wires A,B,C made of the same material and radius have different lengths. The graph in the figures show the elongation-load variation. The longest wire is
View SolutionTwo wires of same material and length are stretched by the same force. If the ratio of radii of the two wires in then the ratio of their elongation is
View SolutionTwo wire of the same material and length stretched by the same force. If the ratio of the radii of the two wires is n : 1 then the ratio of their elongations is
View Solution
