The pie-chart given below shows the changing trends in the recreational activities of children of two different generations. You are disturbed at very little importance being given to book reading followed by sports and games which are mostly indoors resulting in poor health and stamina. You decide to write a letter to the editor of ‘The Herald Tribune’ New Delhi on this issue suggesting ways and means to improve the condition. Sign yourself as Malavika/Manas a Health Specialist from New Delhi and write a letter in about 120 words.
Deptt. of Health Care New Delhi 14th April 20×× The Editor The Herald Tribune New Delhi Subject : Changing Trend in Children’s Activities Sir Through the columns of your esteemed newspaper I wish to draw the attention of the public towards the changing trends in the recreational activities of children in modern times. It is shocking to know that present day children don’t want to spend their leisure hours in book-reading sports and games or any other outdoor activities as was done in the years from 1960-1980. Rather modern day juveniles are more interested in indoor activities. Only 10% of them are interested in book reading whereas 60% can be seen busy with gadgets. This is not a positive trend. It is leading our children towards poor health and stamina. In my opinion children should be made to understand the importance of reading books and this can be done at the school level as well as by parental interference. The advantages of outdoor games must be stressed upon. They must realise that outdoor games impart to them the value of discipline as well as team spirit. Parents should not provide them with electronic gadgets at an early stage. I hope this letter of mine will spread awareness among children as well as parents and that the recreational activities of children will again get channelized in a positive way. Thanking you Yours sincerely Malavika Health Specialist
Related Solutions
Given below is a pie chart showing the time spend by a group of 350 children in different games. Observe it and answer the questions that follow.
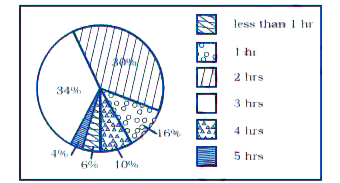
How many children spend at least one hour in playing games?
View SolutionGiven below is a pie chart showing the time spend by a group of 350 children in different games. Observe it and answer the questions that follow.
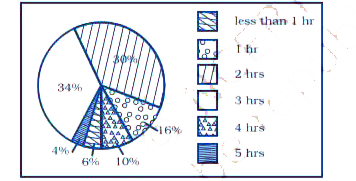
How many children spend 3 or lesser hours in playing games?
View SolutionGiven below is a pie chart showing the time spend by a group of 350 children in different games. Observe it and answer the questions that follow.
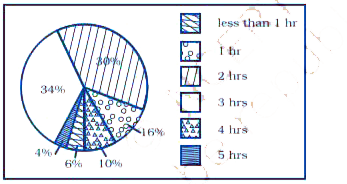
How many children spend more than 2 hours in playing games?
View SolutionA pie chart is given below, which shows the time spent by a group of 350 children in different games. Watch it and answer the questions that follow How many children spend 3 or less hours playing?
View SolutionA pie chart is given below, which shows the time spent by a group of 350 children in different games. Watch it and answer the questions that follow How many children spend more than 2 hours playing?
View SolutionA pie chart is given below, which shows the time spent by a group of 350 children in different games. Watch it and answer the questions that follow How many children spend at least one hour playing daily?
View SolutionThe given pie-chart shows favourite sport of students of a school.
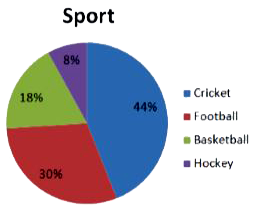
In the given pie-chart, what is the difference in percentage between liking for football and basketball?
View SolutionThe given pie chart shows the expenditure in crores on each game. In the given pie chart, what is the difference between the expenditure on cricket and football?
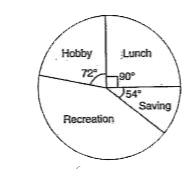
View SolutionThe pie chart given below shows the expenses incurred and saving by a family in a month. What is the percentage of expenses incurred on account of recreation ?
View SolutionThe given pie chart shows expenditure on different type of sport in a particular year . Study the pie chart and answer the question below
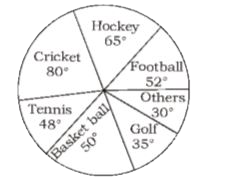
IF total expenditure on sport was Rs 24000000 then total expenditure on cricket and football will be
View SolutionThe given pie chart shows expenditure on different type of sport in a particular year . Study the pie chart and answer the question below
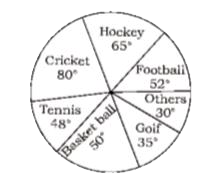
IF in a year the expenditure on sport was 18000000 then expenditure on tennis was how much more than expenditure on golf.
View SolutionThe pie chart on the right shows the results of a survey conducted by the children of a school regarding the means of transport used for coming to school. Study this pie chart and answer the question that follows. What part (different) of the number of children travels by car?
View SolutionYou read in a newspaper the news An Old Couple Murdered in South Delhi. You decide to write a letter to the Commissioner of Police, complaining against the rising rate of crime against the old people. Write the letter giving suggestions for the security of the elderly. You are Panchal of B-6/12, Phase I, Ashok Vihar.
View SolutionThe given pie chart shows the expenditure in crores on each game. In the given pie, what will be the central angle of the segment representing the football?
View SolutionYou are disturbed at seeing many unfortunate homeless orphans spending their night in the open on chilly wintry nights. Using the information given below, write a letter to the Minister, Urban Development, Government of Delhi, New Delhi urging the state administration to provide free night shelters to the needy and homeless poor.
View SolutionThe given pie-chart shows favourite sport of students of a school.
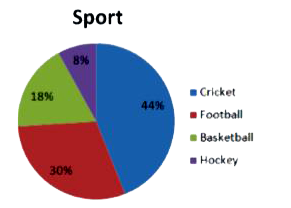
In the given pie-chart, if there were 1280 students in all, how many liked football?
View SolutionIf there is no difference, do you think that your findings mean that being well-off or poor does not matter for health ?
View SolutionIf there is no difference, do you think that your findings mean that being well-off or poor does not matter for health ?
View SolutionThe given pie chart depicts the expenditure incurred in crores towards each sport. In the given pie chart what is the difference between the expenditure incurred on cricket on football
View SolutionWhen writing a letter to editor, you think about the newspaper to which the letter is to be sent. What else is important?
View Solution