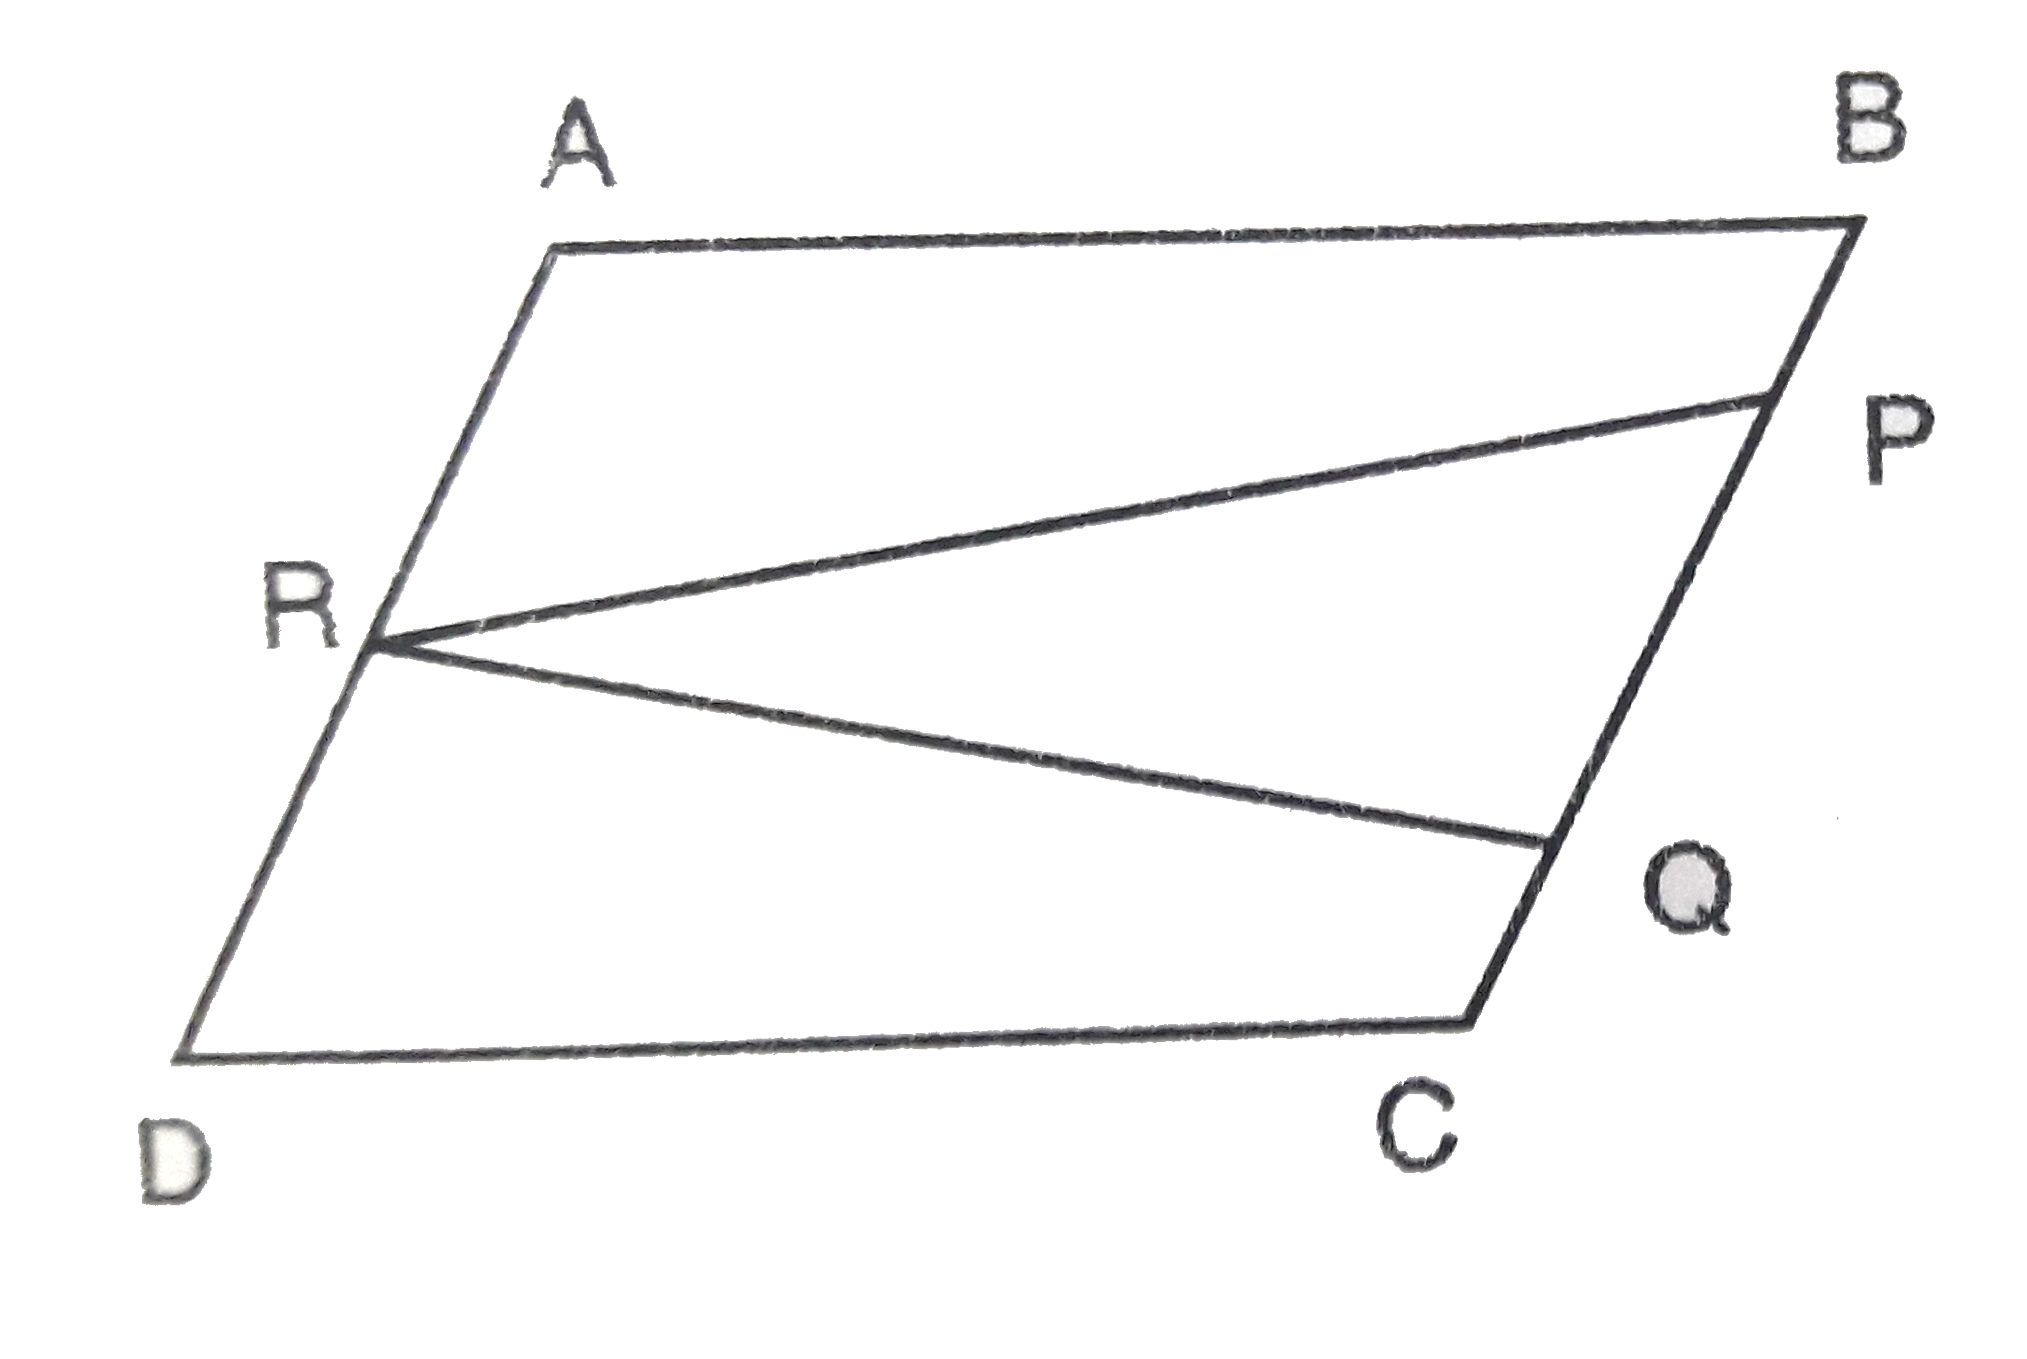
आकृति में आकृति एक ही आधार तथा समान समांतर रेखाओं के बीच स्थित है :

समांतर चतुर्भुज ABCD तथा ΔPQR दो समान रेखाओं AD तथा BC के बीच स्थित है परन्तु इनका आधार एक नहीं है।
Topper's Solved these Questions
- समांतर चतुर्भुजों और त्रिभुजों के क्षेत्रफल BOOK - RD SHARMACHAPTER - समांतर चतुर्भुजों और त्रिभुजों के क्षेत्रफल EXERCISE - प्रश्नावली 15.2
4 Videos
- समांतर चतुर्भुजों और त्रिभुजों के क्षेत्रफल BOOK - RD SHARMACHAPTER - समांतर चतुर्भुजों और त्रिभुजों के क्षेत्रफल EXERCISE - प्रश्नावली 15.3
29 Videos
- समांतर चतुर्भुजों और त्रिभुजों के क्षेत्रफल BOOK - RD SHARMACHAPTER - समांतर चतुर्भुजों और त्रिभुजों के क्षेत्रफल EXERCISE - व्याख्यात्मक उदाहरण
1 Videos
- संख्यिकीय आंकड़ों का आलेखीय निरूपण BOOK - RD SHARMACHAPTER - संख्यिकीय आंकड़ों का आलेखीय निरूपण EXERCISE - बहु विकल्पीय प्रश्न
8 Videos
- सर्वांगसम त्रिभुजेंBOOK - RD SHARMACHAPTER - सर्वांगसम त्रिभुजेंEXERCISE - बहु विकल्पीय प्रश्न
17 Videos
Similar Questions
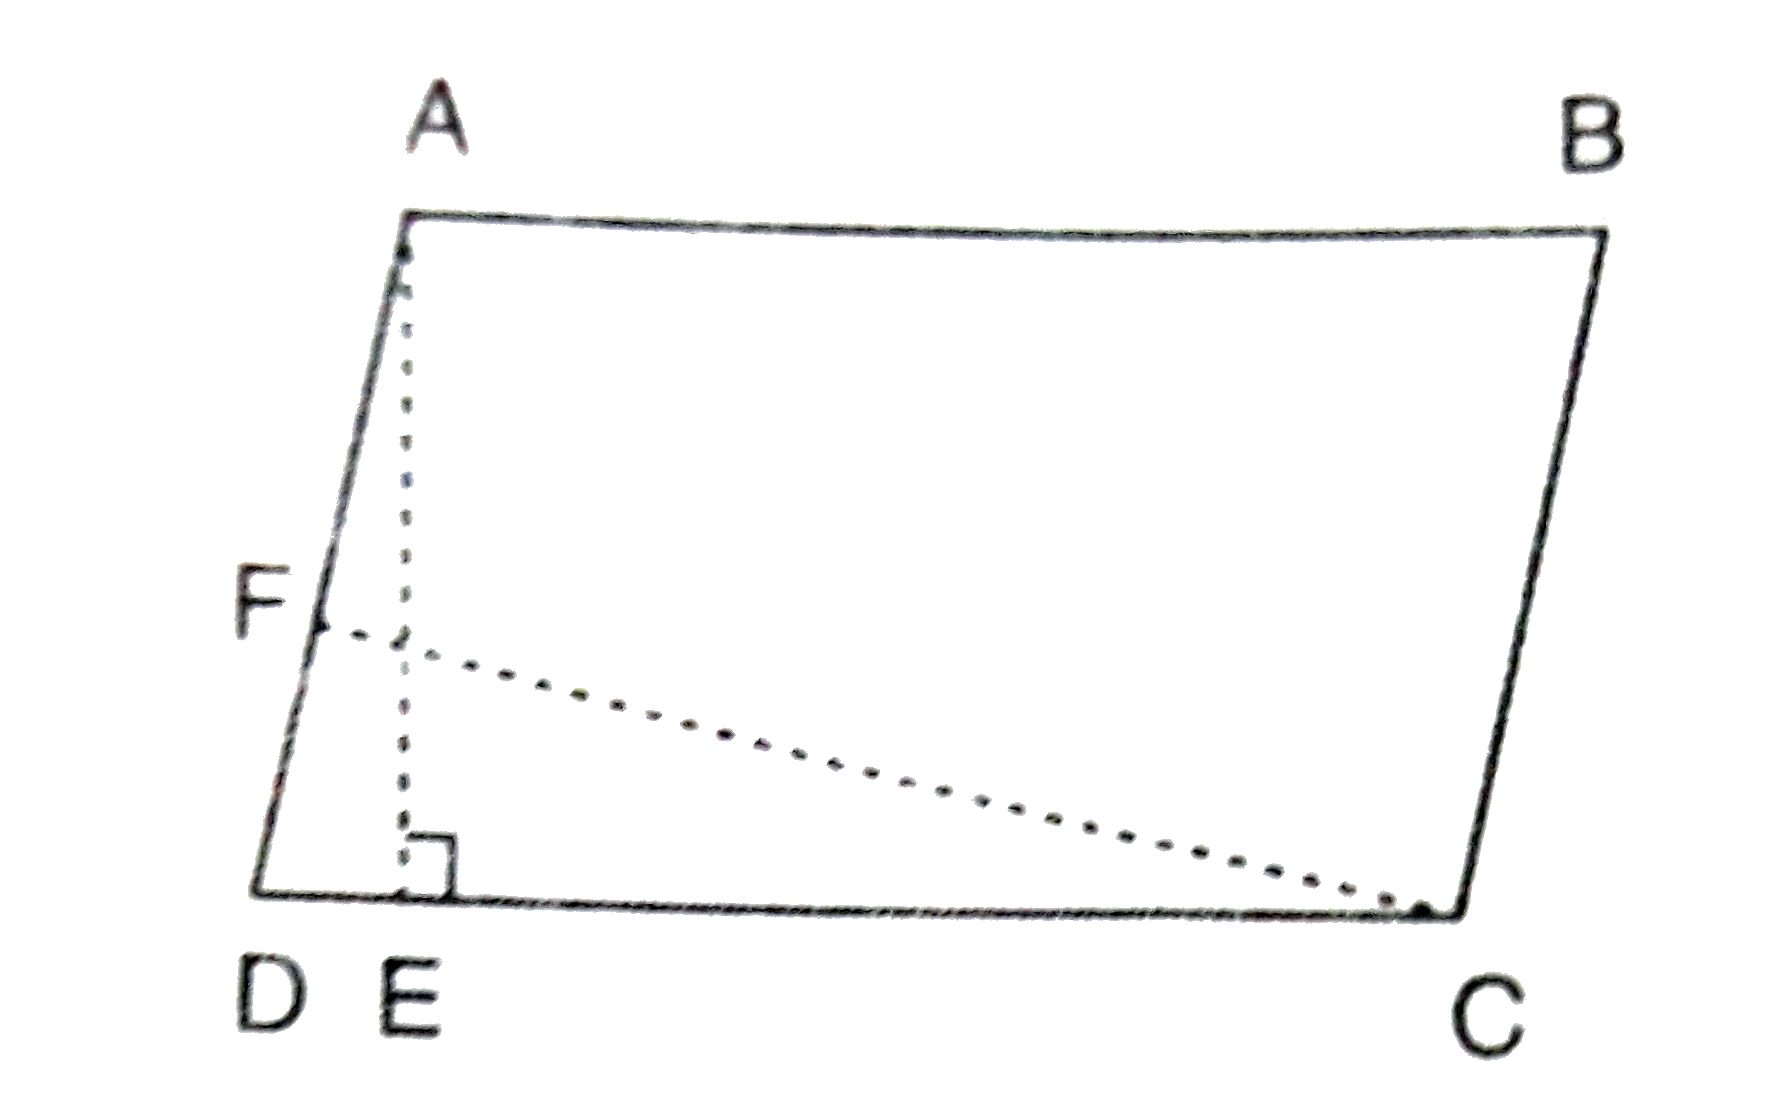
चित्र में , ABCD एक समान्तर चतुर्भुज है। AE⊥DC तथा CF⊥AD । यदि AB = 16 सेमी, AE = 8 सेमी तथा CF = 10 सेमी , तो AD का मान ज्ञात कीजिये ।

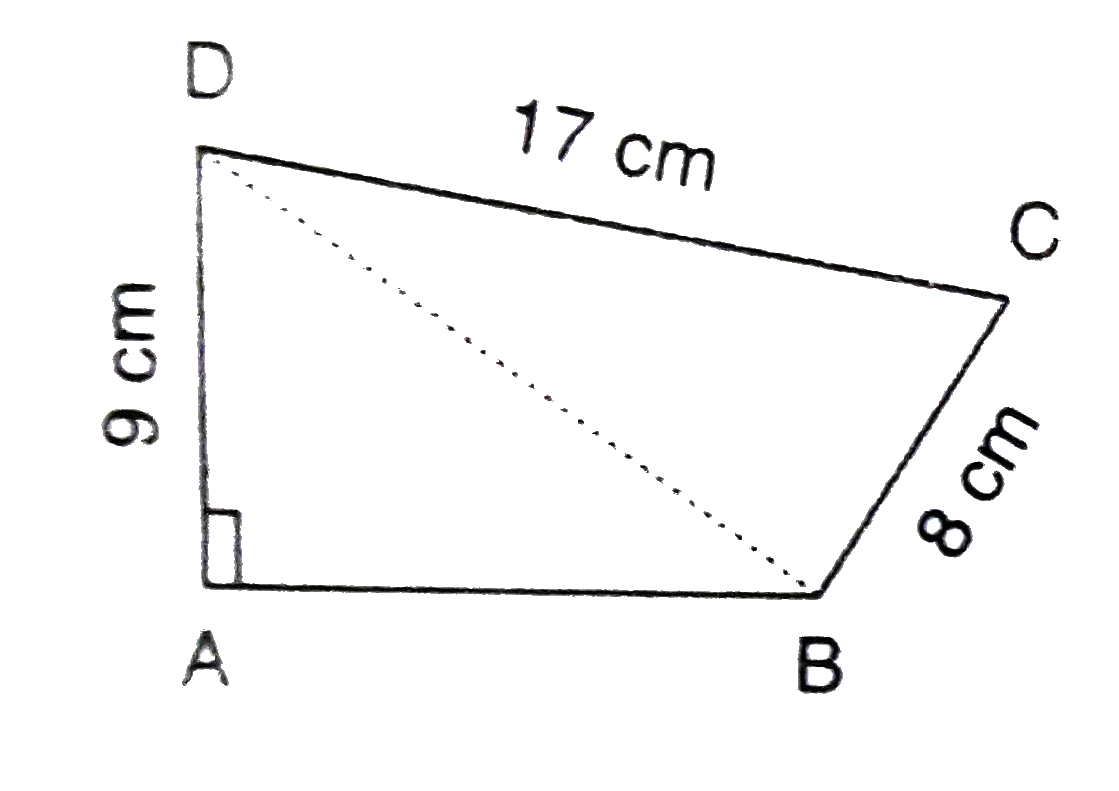
View Solutionचित्र में, चतुर्भुज ABCD का क्षेत्रफल ज्ञात कीजिए।

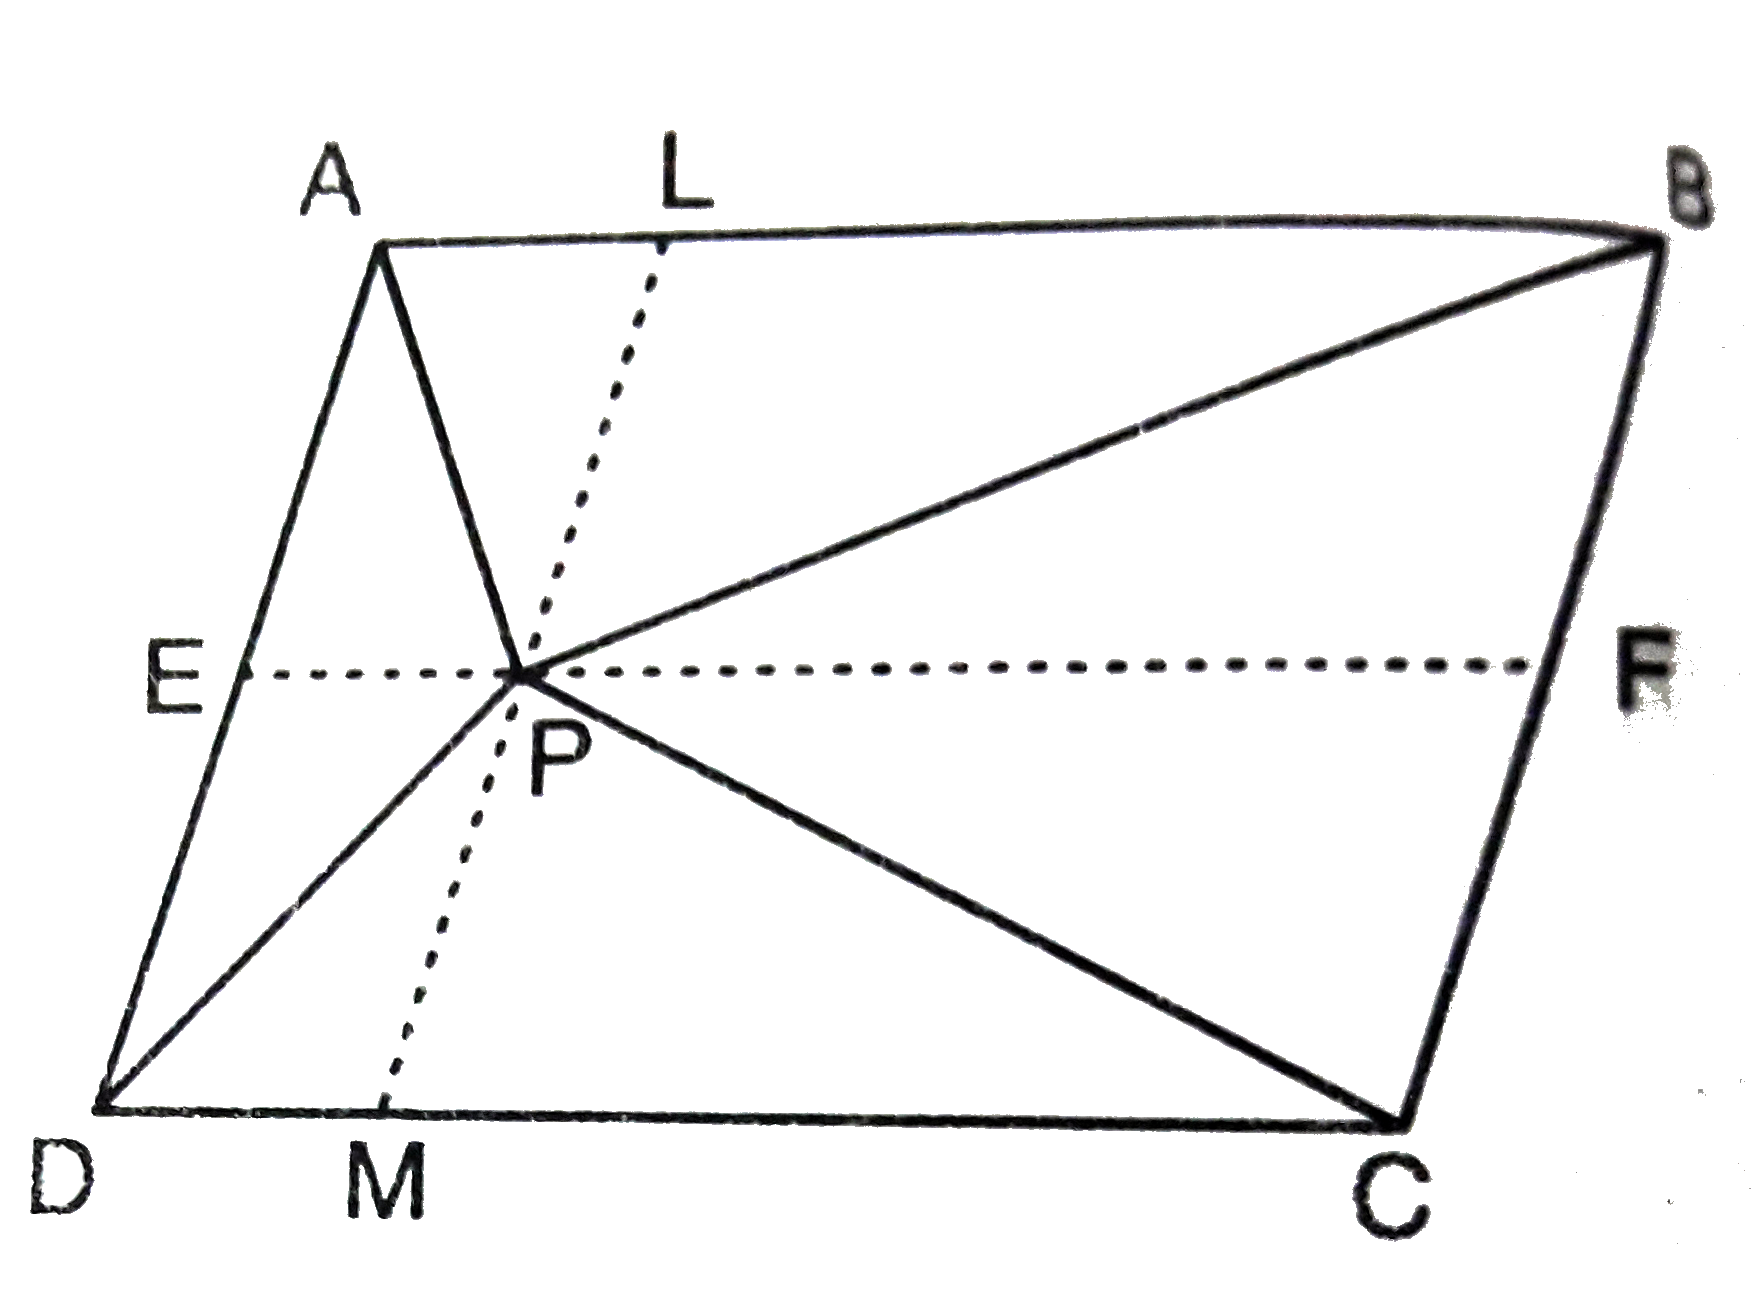
View Solutionचित्र में , P समान्तर चतुर्भुज ABCD के अभ्यन्तर में स्थित कोई बिंदु है दर्शाइए कि
(i) ar(ΔAPB)+ar(ΔPCD)=12ar(।।gmABCD)
(ii) ar(ΔAPD)+ar(ΔPBC)=ar(ΔAPB)+ar(ΔPCD)

View Solutionनिम्न में से कौन - सा , सांख्यिकीय आकड़ो का लेखा चित्रीय निरूपण नहीं है ?
View Solutionयदि ΔABC≅ΔLKMहों, तो ΔLKMकी कौन सी भुजा ΔABCकी भुजा BC के एक बराबर होगी ?
View SolutionHow many lines of symmetry does the above figure have ?
View SolutionWhich of the following are correct chain isomers of butane ? (i)
View SolutionDetermine the point of symmetry of a regular hexagon.
View SolutionDtermine the images of the following figure about the given line :
View SolutionMatch the following Column A to Column B

View SolutionMatch the following Column A to Column B

View SolutionMatch the following Column A to Column B

View SolutionThe inequation represented by the graph given below is :
View SolutionThe inequation that best describes the graph given below is _________
View SolutionThe inequation that best describes the following graph is _________
View SolutionWhich inequations represent the shaded region in the given figure
View Solution
