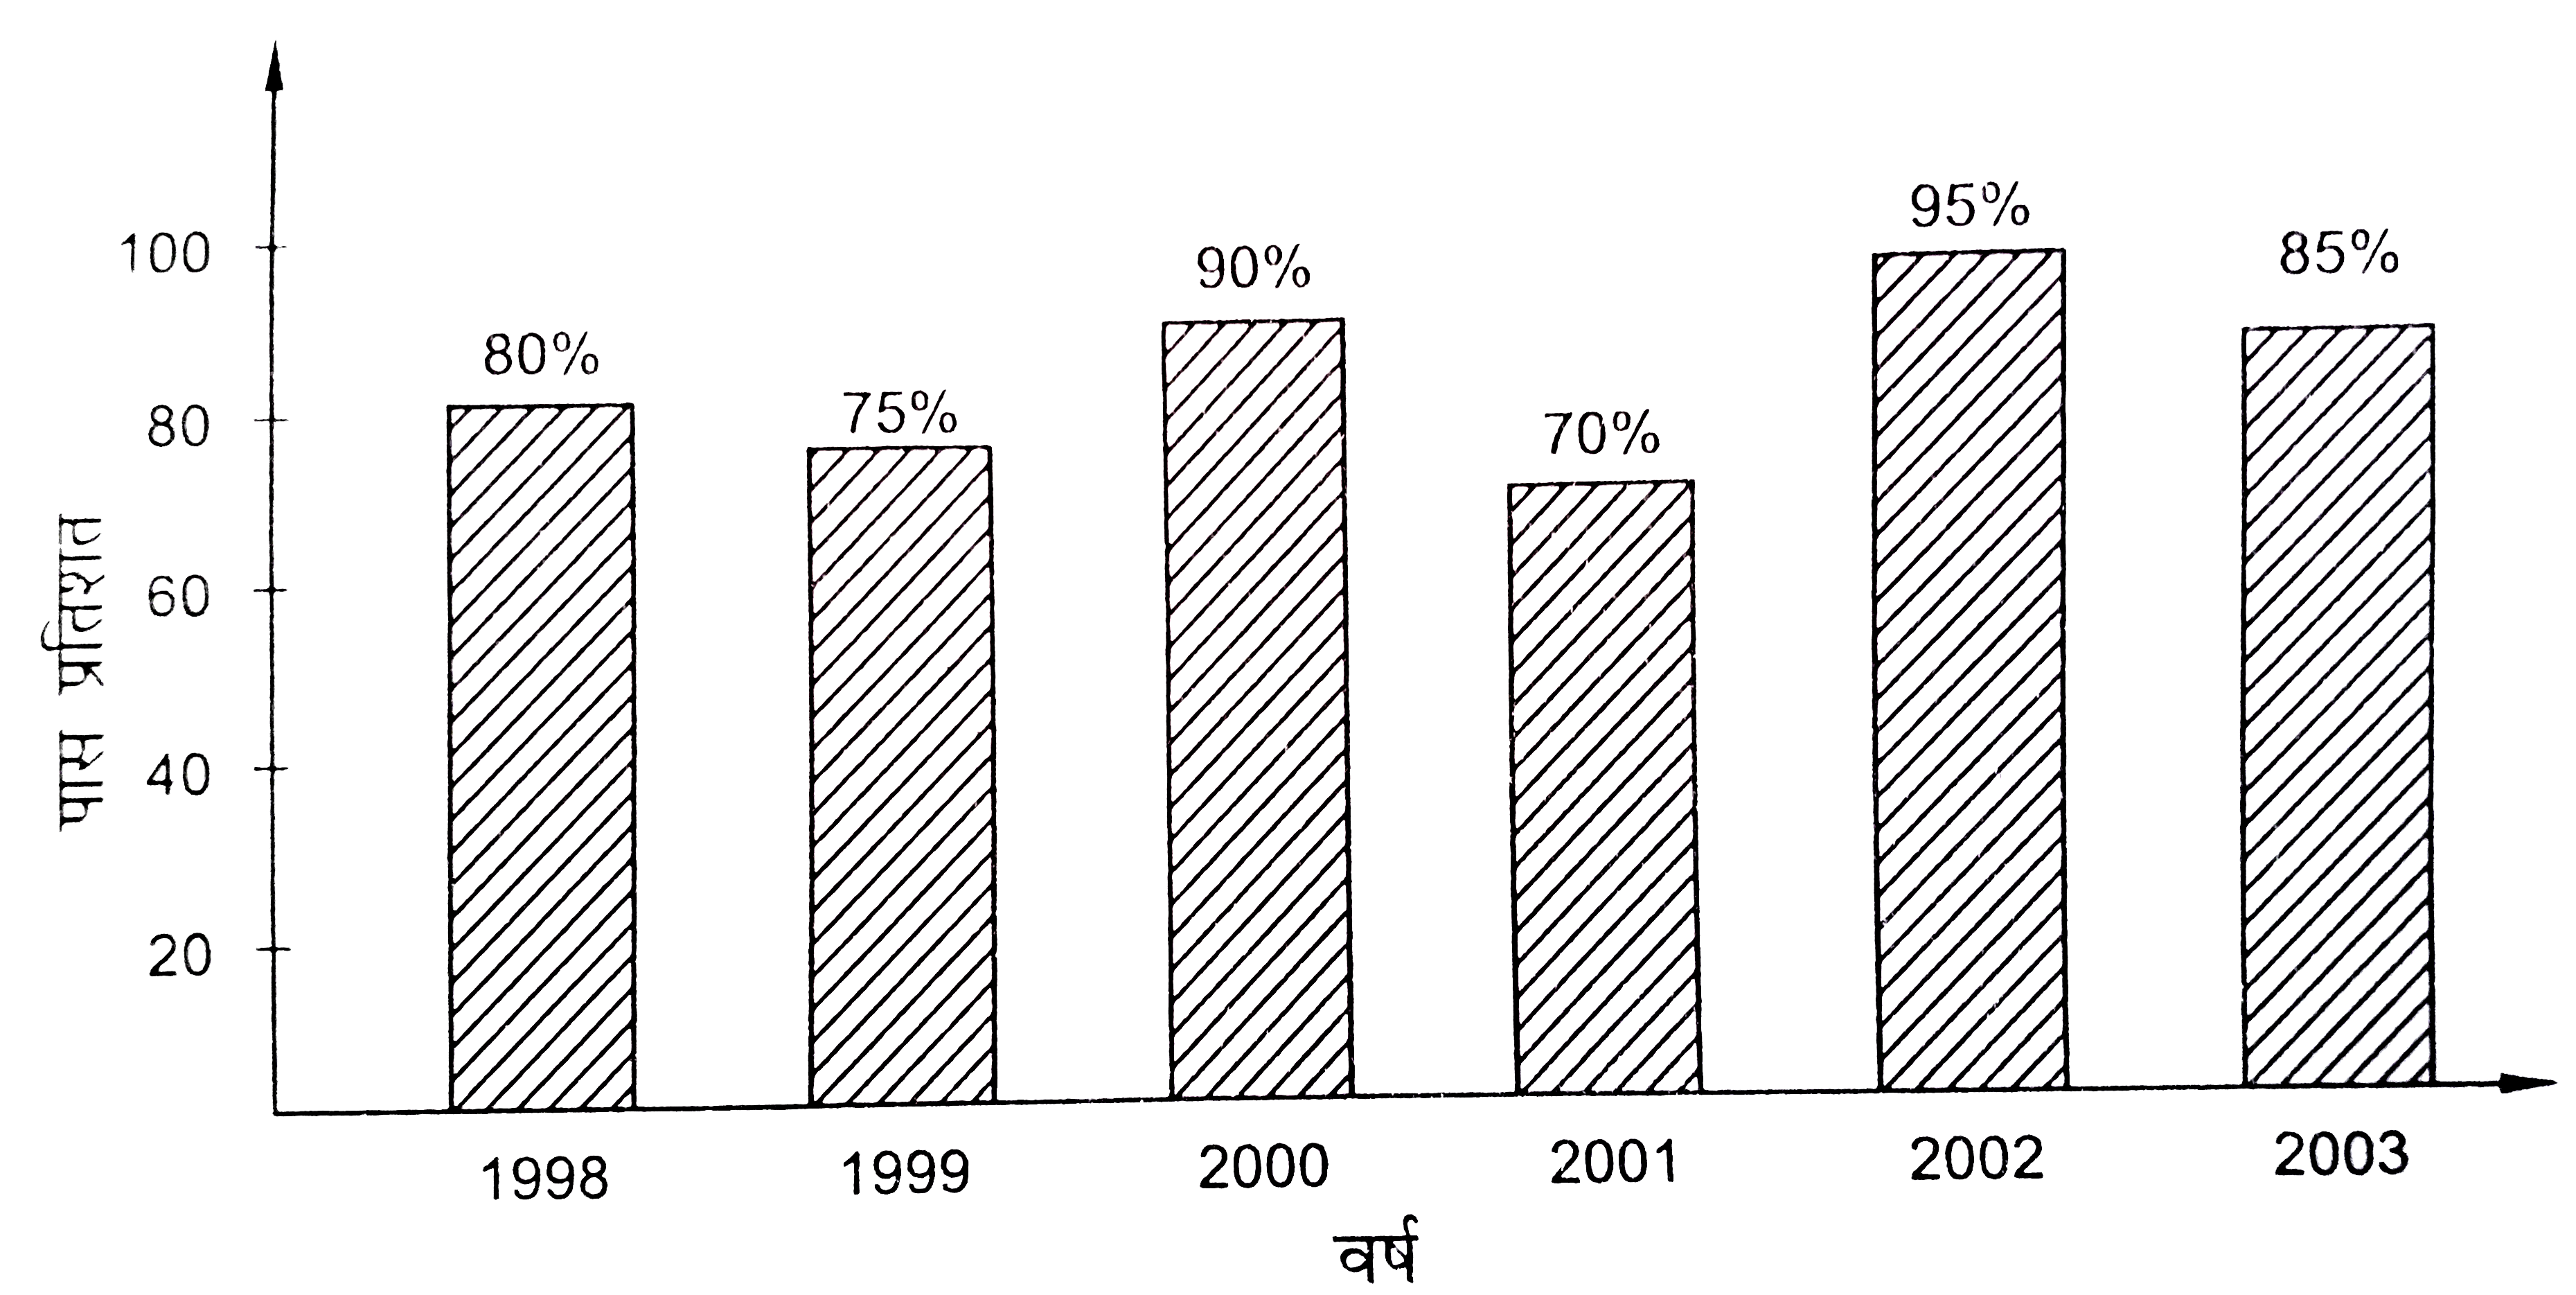
वर्ष 1998-2003 के बीच छात्रों के पास होने के प्रतिशत को निम्न सारणी में दर्शाया गया है इन आकड़ो के लिए एक दण्ड आलेख खींचिए :

Topper's Solved these Questions
- सैंपल प्रश्नपत्र BOOK - RD SHARMACHAPTER - सैंपल प्रश्नपत्र EXERCISE - खण्ड - द
1 Videos
- सैंपल प्रश्नपत्र BOOK - RD SHARMACHAPTER - सैंपल प्रश्नपत्र EXERCISE - सैंपल प्रश्नपत्र -2
39 Videos
- सांखि्यिकीय आँकड़ों का सारणीयनBOOK - RD SHARMACHAPTER - सांखि्यिकीय आँकड़ों का सारणीयनEXERCISE - बहु विकल्पीय प्रश्न
10 Videos
- हीरोन का सूत्र BOOK - RD SHARMACHAPTER - हीरोन का सूत्र EXERCISE - बहु विकल्पीय प्रश्न
15 Videos
Similar Questions
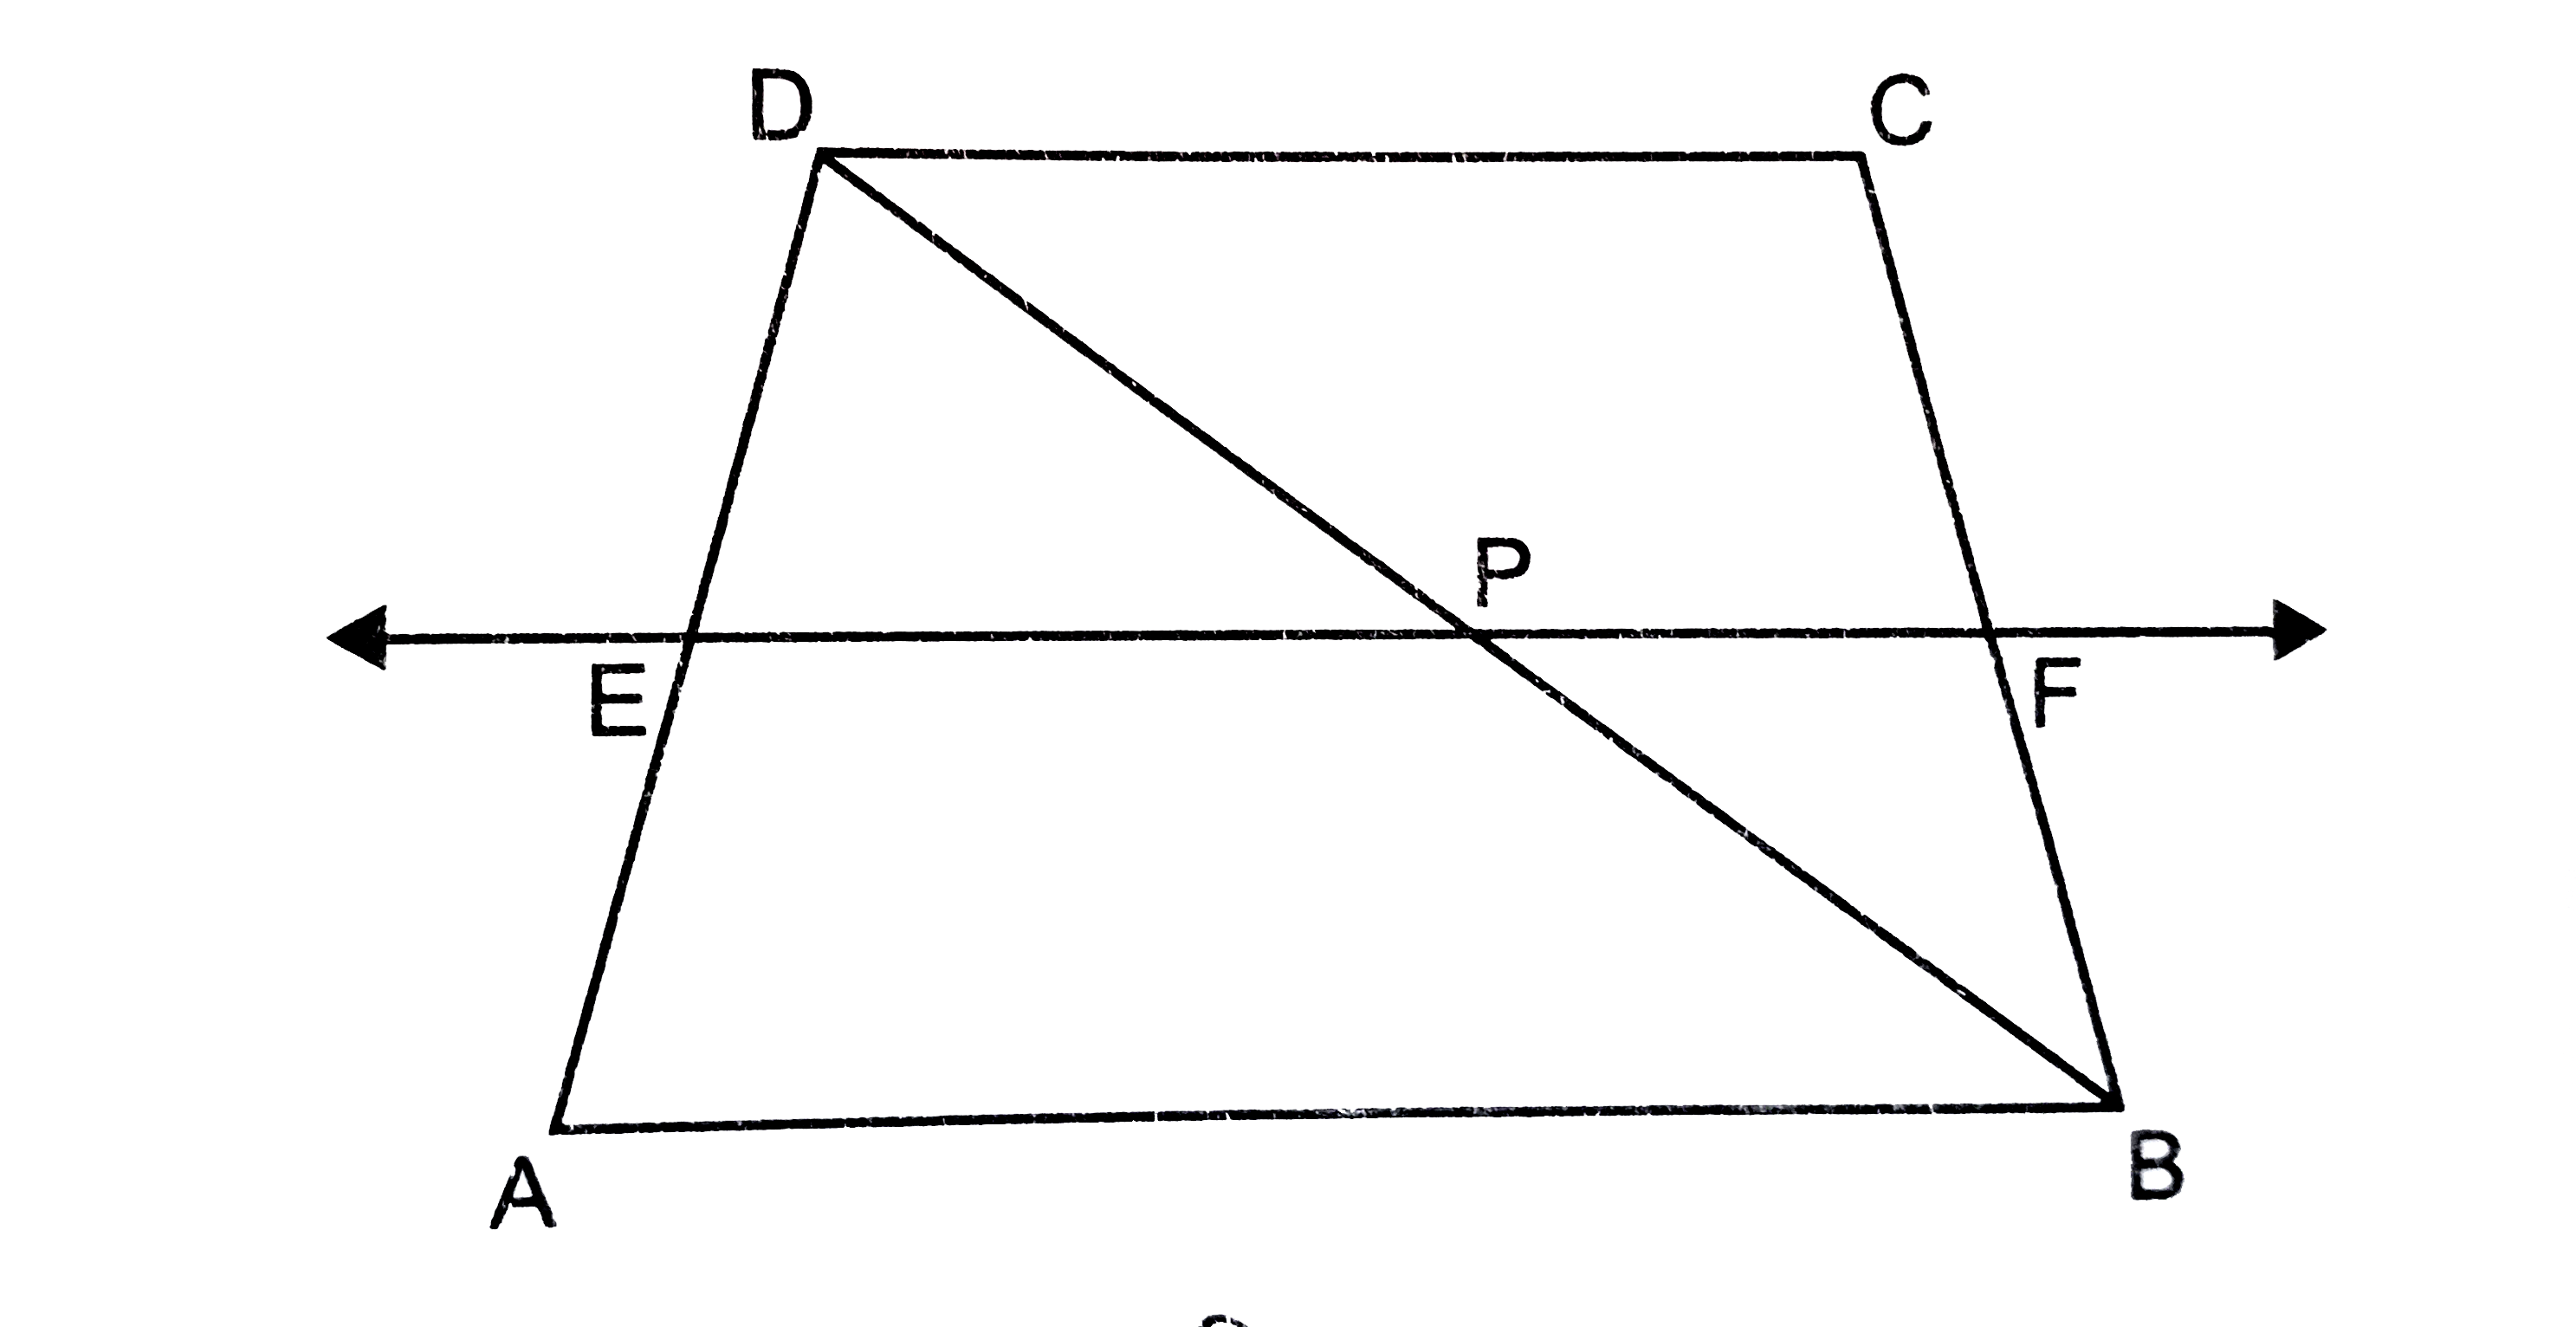
चित्र 12 में , ABCD एक समलंब चतुर्भुज है जिसमे AB|| DC है । एक विकर्ण है तथा E, AD का मध्य बिंदु है । E से जाती हुई एक रेखा AB के समांतर खींची गयी है जो BC को बिंदु F पर काटती है । दर्शाइए की F भुजा BC का मध्य बिंदु है ।

View Solutionएक परिमेय संख्या का दशमलव-प्रसार नहीं हो सकता है :
View Solutionप्रेक्षणो के सग्रह में से उच्चतम एव न्यूनतम प्रेक्षणो के अन्तर को कहते है ?
View Solutionयदि एक त्रिभुज की भुजाएँ 16 सेमी., 30 सेमी व 34 सेमी. लम्बाई की है, तो इसका क्षेत्रफल होगा :
View SolutionHow many lines of symmetry does the above figure have ?
View SolutionWhich of the following are correct chain isomers of butane ? (i)
View SolutionDetermine the point of symmetry of a regular hexagon.
View SolutionDtermine the images of the following figure about the given line :
View SolutionMatch the following Column A to Column B

View SolutionMatch the following Column A to Column B

View SolutionMatch the following Column A to Column B

View SolutionFind the area of the figure given below.

View SolutionThe area of the shaded part in the figure given below is ______.

View SolutionThe inequation represented by the graph given below is :
View SolutionThe inequation that best describes the graph given below is _________
View SolutionThe inequation that best describes the following graph is _________
View Solution

