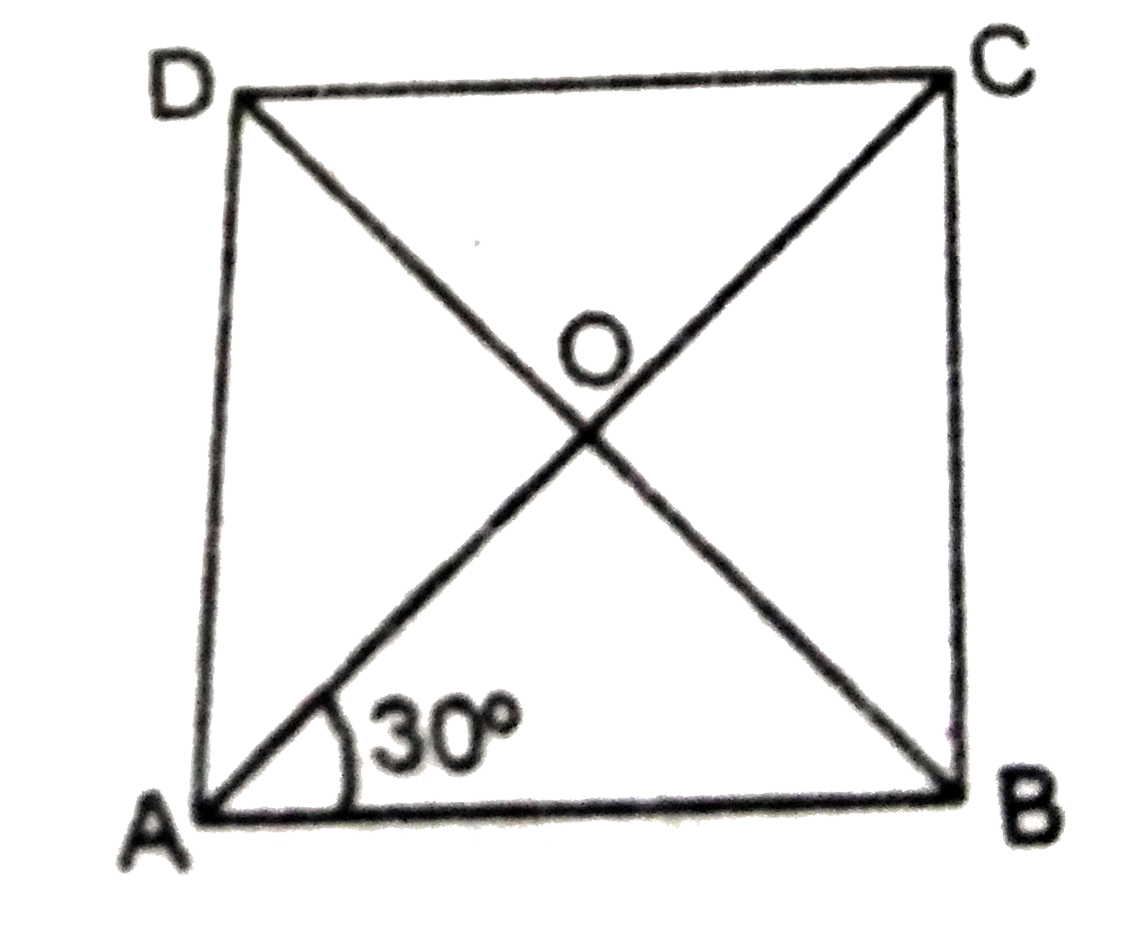
बगल के चित्र में ABCD समचतुर्भुज है इसके विकर्ण O पर मिलते हैं तथा ∠OAB=30∘ तो ∠OBA बराबर है

40∘
50∘
60∘
75∘
The correct Answer is:C
Step by step video & image solution for बगल के चित्र में ABCD समचतुर्भुज है इसके विकर्ण O पर मिलते हैं तथा /_OAB=30^(@) तो /_OBA बराबर है by Maths experts to help you in doubts & scoring excellent marks in Class 9 exams.
Topper's Solved these Questions
- BOOK - KC SINHACHAPTER - समांतर चतुर्भुजEXERCISE - दीर्घ उत्तरीय प्रश्न (समांतर चतुर्भुज से संबंधित प्रमेयों, उपप्रमेयों एवं पूर्व पठित अभिगृहितों, प्रमेयों तथा उपप्रमेयों के प्रयोग से साबित करने पर आधारित प्रश्नः)4videos
समांतर चतुर्भुज
- BOOK - KC SINHACHAPTER - वृत्त EXERCISE - वस्तुनिष्ठ प्रश्न17videos
वृत्त
- BOOK - KC SINHACHAPTER - समांतर चतुर्भुजों और त्रिभुजों के क्षेत्रफल EXERCISE - वस्तुनिष्ट प्रश्न7videos
समांतर चतुर्भुजों और त्रिभुजों के क्षेत्रफल
Similar Questions
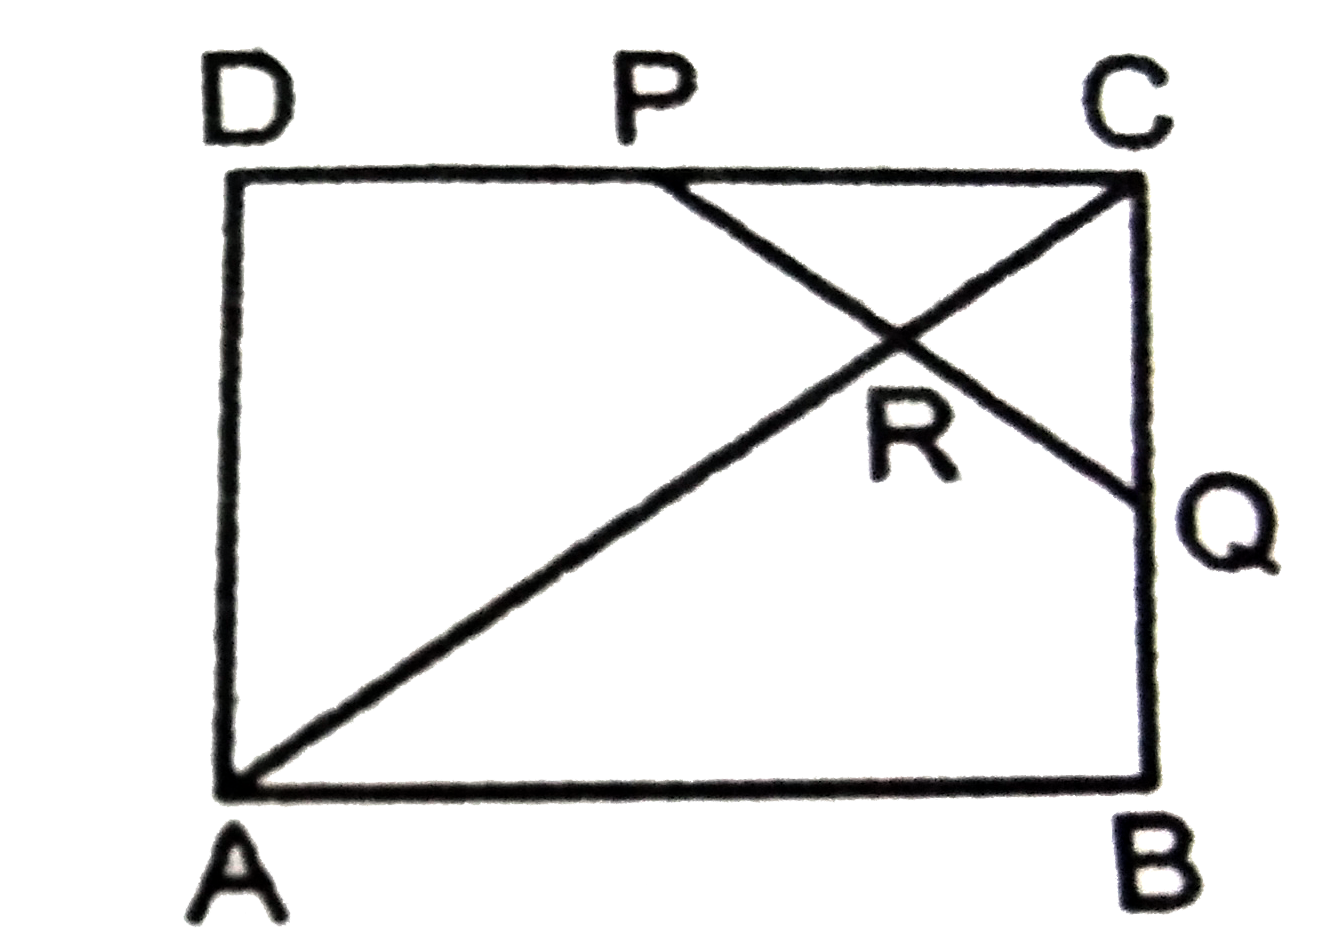
समांतर चतुर्भुज ABCD में P और Q क्रमशः DC और BC के मध्य बिंदु हैं। सिद्ध करें कि CR=14AC.
 01:37View Solution
वृत्त पर किन्ही दो बिन्दुओं को मिलाने वाली रेखाखंड को क्या कहते है ?
06:07View Solutionसमचतुर्भुज के विकर्णों का गुणनफल समचतुर्भुज के क्षेत्रफल का कितना गुना होता है ?
02:11View SolutionHow many lines of symmetry does the above figure have ?
01:31View SolutionWhich of the following are correct chain isomers of butane ? (i)
02:45View SolutionDetermine the point of symmetry of a regular hexagon.
02:17View SolutionDtermine the images of the following figure about the given line :
05:41View SolutionMatch the following Column A to Column B
 02:21View Solution
Match the following Column A to Column B
 02:03View Solution
Match the following Column A to Column B
 02:10View Solution
Find the area of the figure given below.
 02:17View Solution
The area of the shaded part in the figure given below is ______.
 02:10View Solution
The inequation represented by the graph given below is :
04:23View SolutionThe inequation that best describes the graph given below is _________
01:13View SolutionThe inequation that best describes the following graph is _________
03:12View SolutionWhich inequations represent the shaded region in the given figure
05:46View Solution

