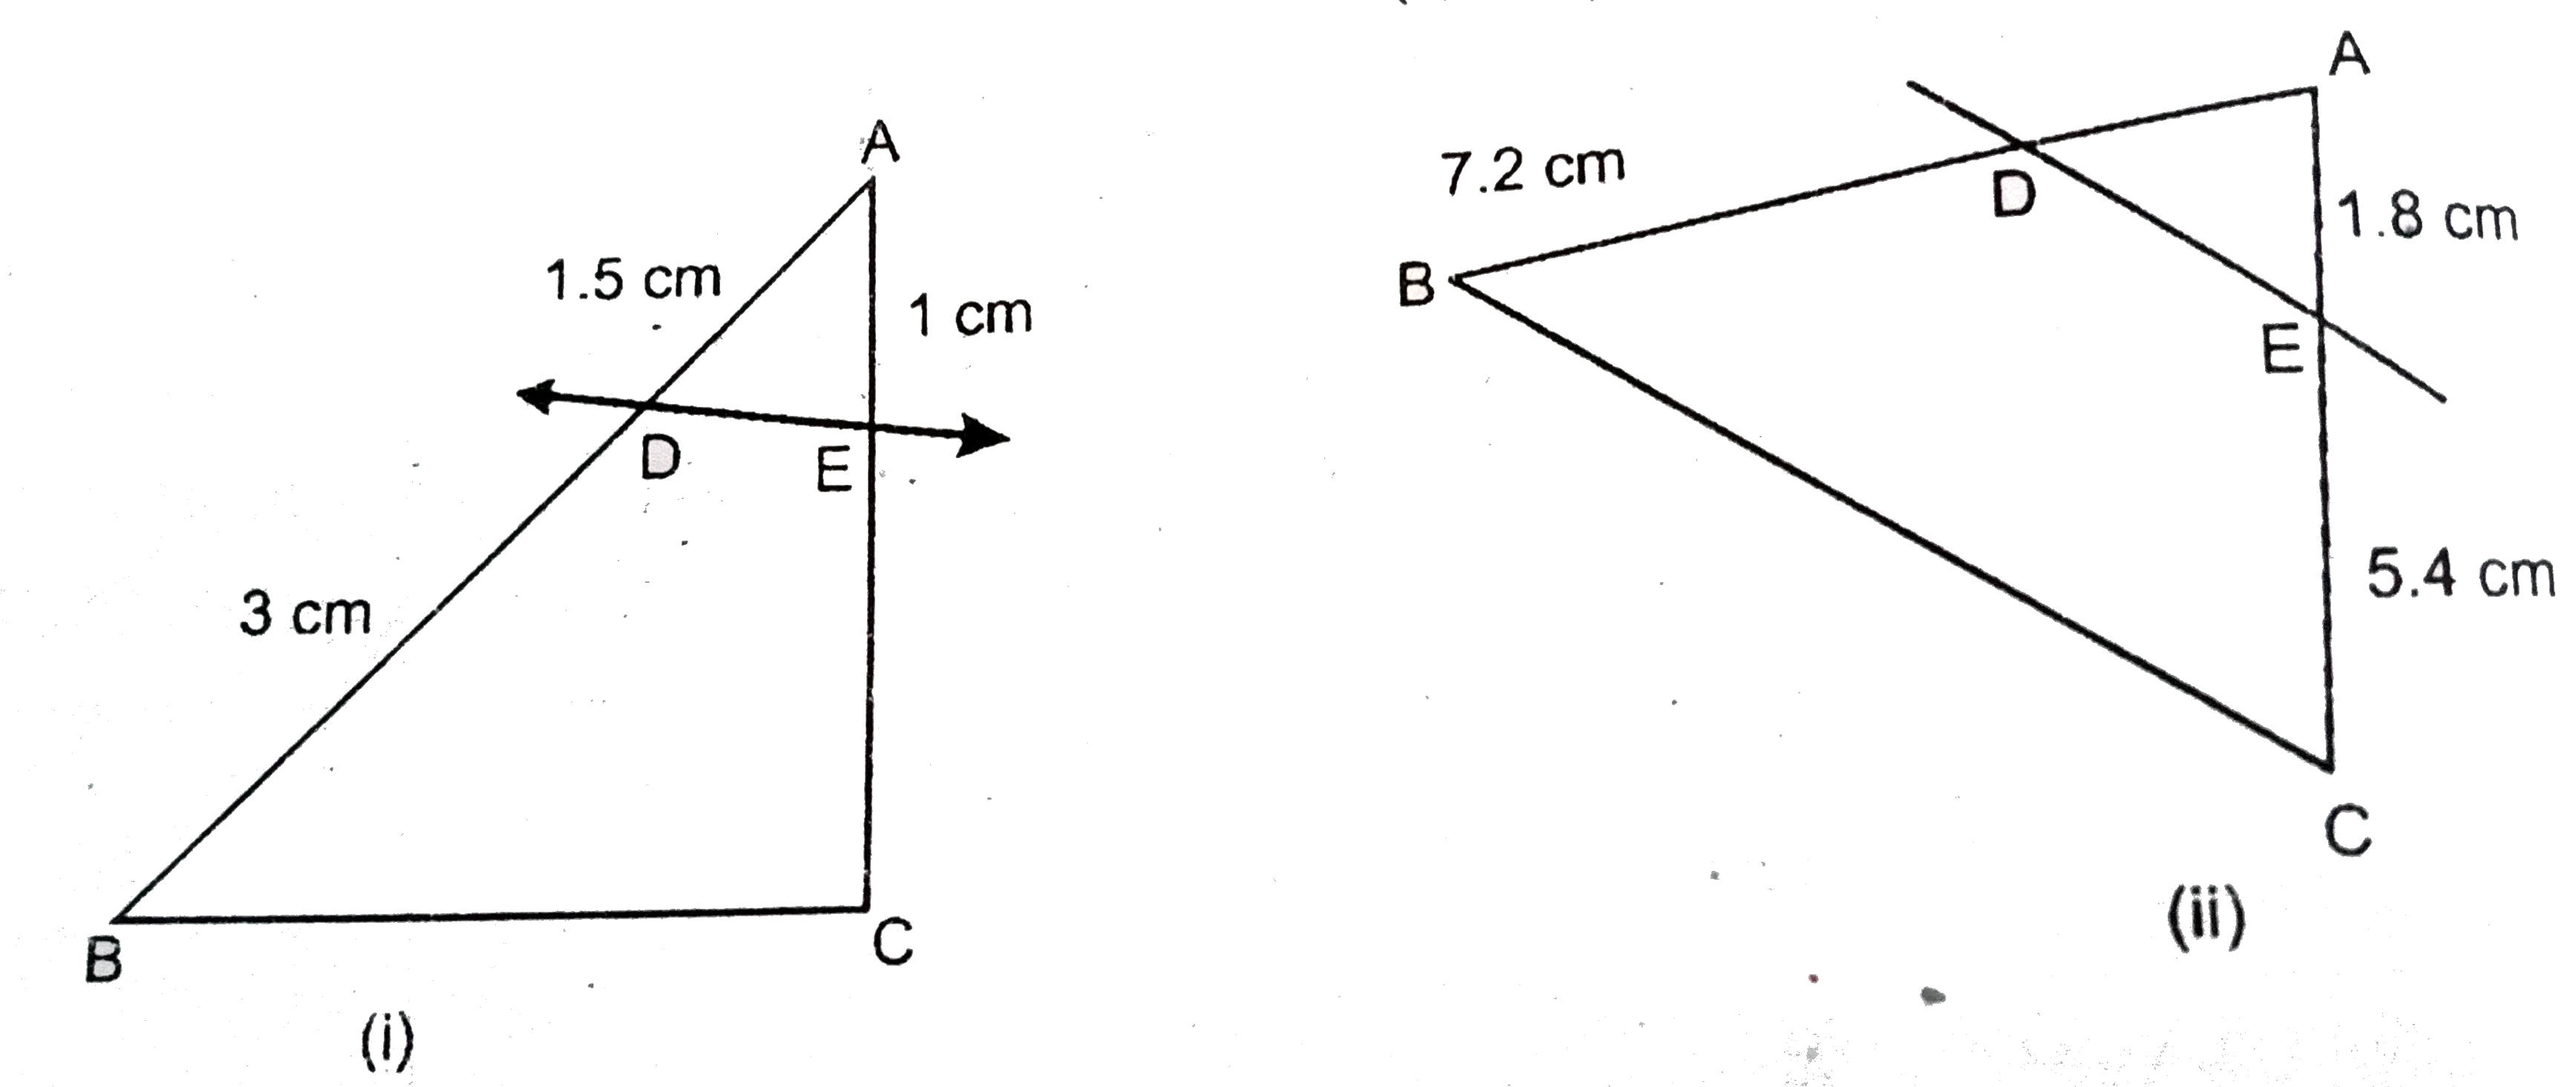
चित्र (i) और (ii) में DE∣∣BC तो (i) में EC और चित्र (ii) में AD ज्ञात करें ।

The correct Answer is:(i) EC=2cm (ii)AD=2.4cm
Step by step video & image solution for चित्र (i) और (ii) में DE||BC तो (i) में EC और चित्र (ii) में AD ज्ञात करें । by Maths experts to help you in doubts & scoring excellent marks in Class 10 exams.
Updated on:21/07/2023Topper's Solved these Questions
- त्रिभुज BOOK - KC SINHACHAPTER - त्रिभुज EXERCISE - EXCERCISE 6.2 (लघु उत्तरीय प्रश्न )
11 Videos
- त्रिभुज BOOK - KC SINHACHAPTER - त्रिभुज EXERCISE - EXCERCISE 6.3 (लघु उत्तरीय प्रश्न) ( Short Answer Type Questions)
15 Videos
- त्रिभुज BOOK - KC SINHACHAPTER - त्रिभुज EXERCISE - EXCERCISE 6.1
22 Videos
- त्रिकोणमितीय अनुपात और सर्वसमिकाएँ BOOK - KC SINHACHAPTER - त्रिकोणमितीय अनुपात और सर्वसमिकाएँ EXERCISE - EXERCISE 8.4
85 Videos
- दो चर वाले रैखिक समीकरण युग्मBOOK - KC SINHACHAPTER - दो चर वाले रैखिक समीकरण युग्मEXERCISE - वस्तुनिष्ठ प्रश्न
44 Videos
Similar Questions
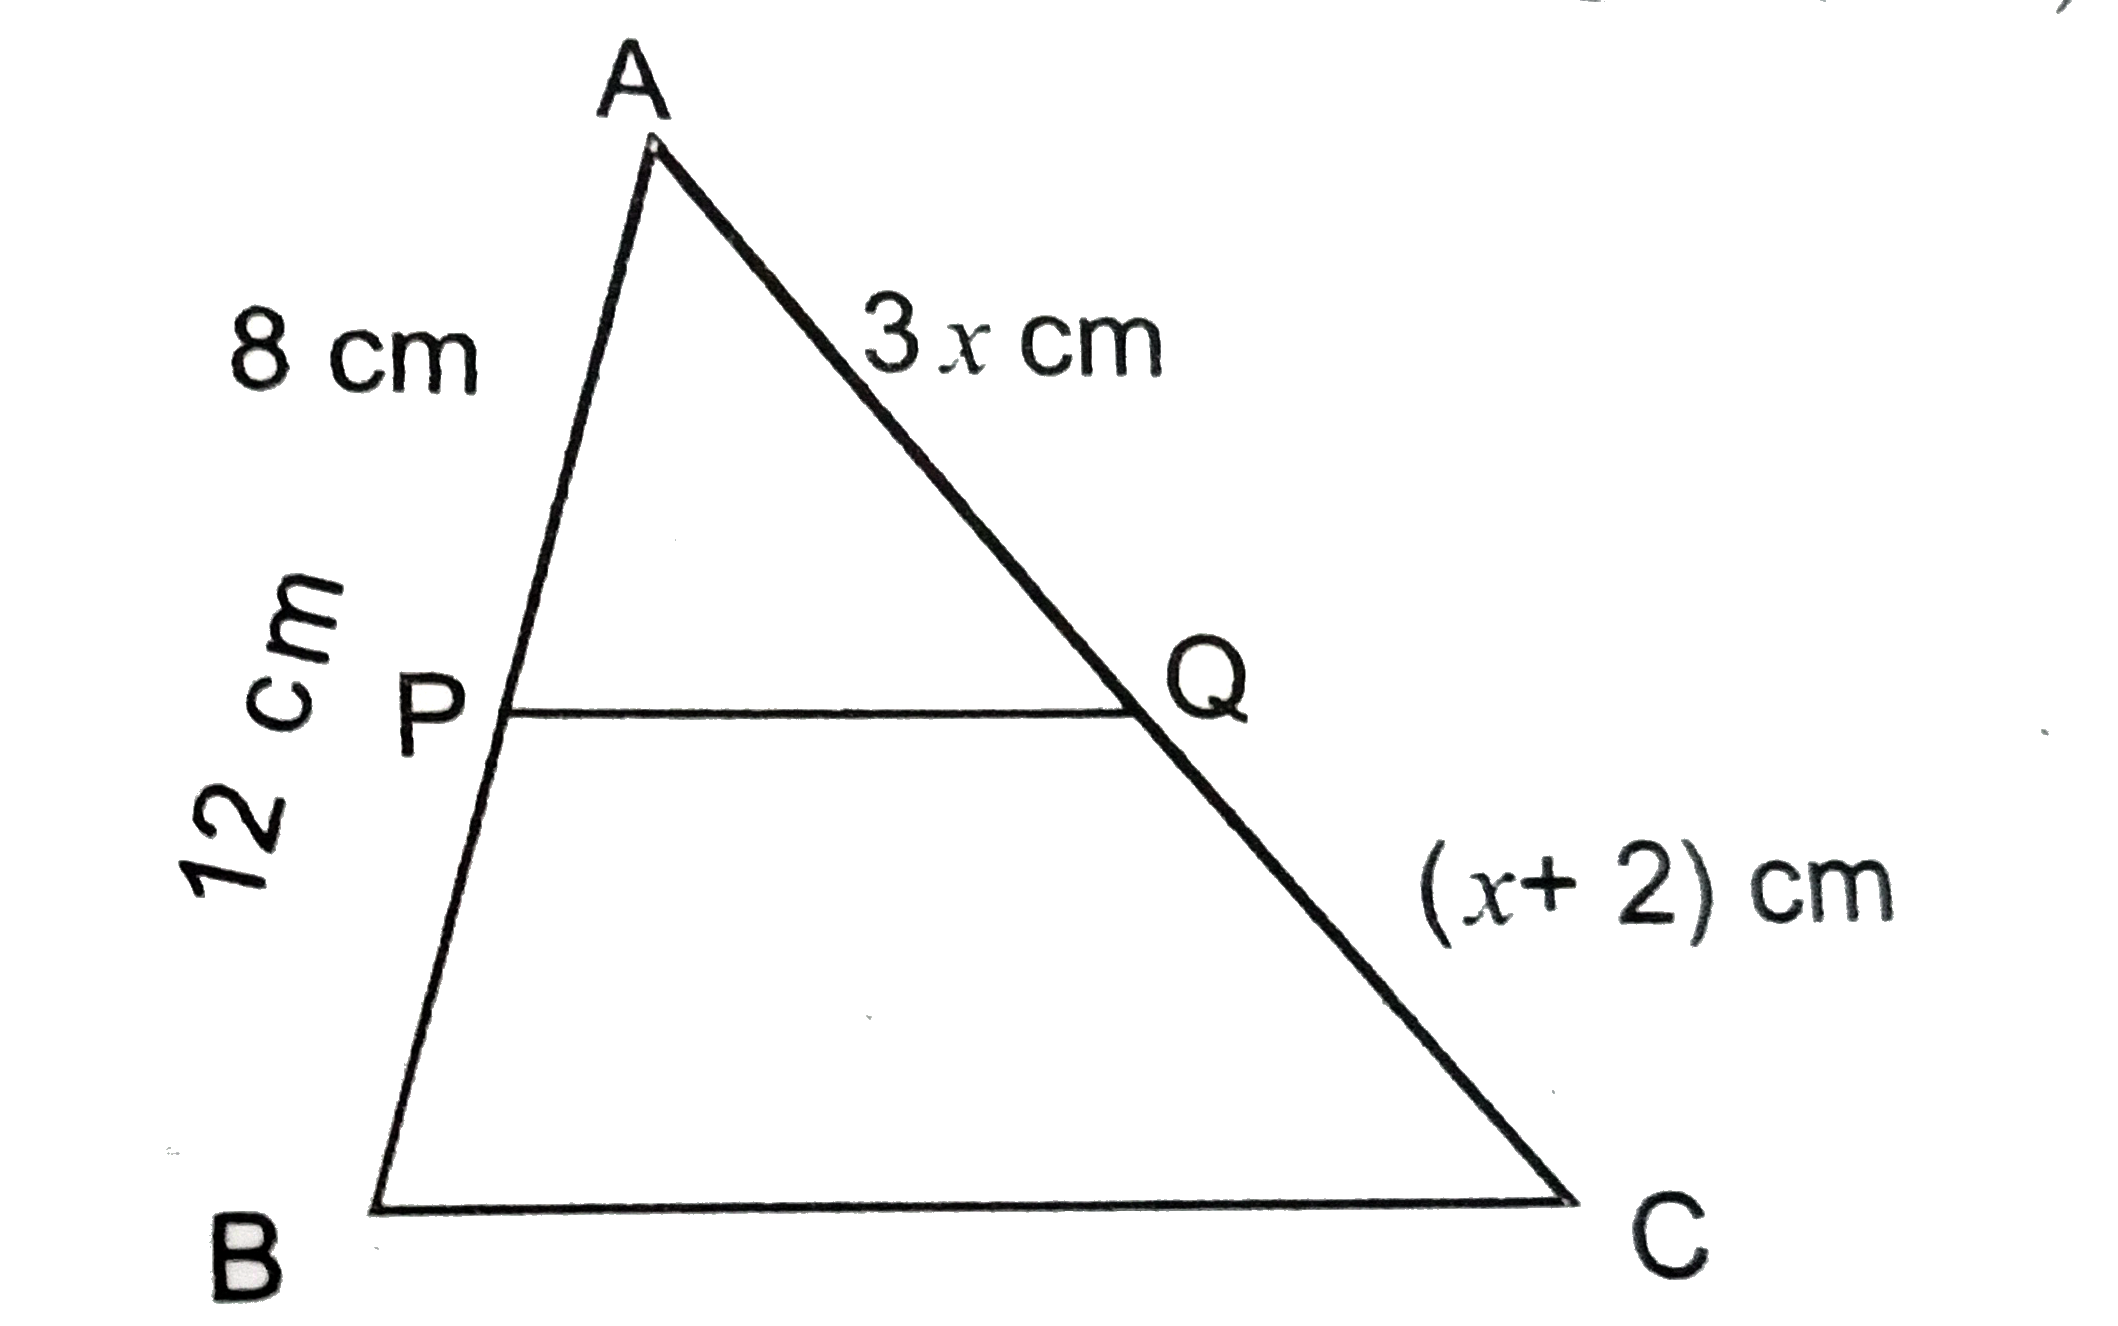
नीचे के चित्र में P और Q,ΔABC की भुजाएँ AB और AC पर क्रमशः दो बिन्दु इस प्रकार है कि PQ∣∣BC तथा AP=8cm,AB=12cm,AQ=3xcm,QC=(x+2)cm. x का मान ज्ञात करें ।

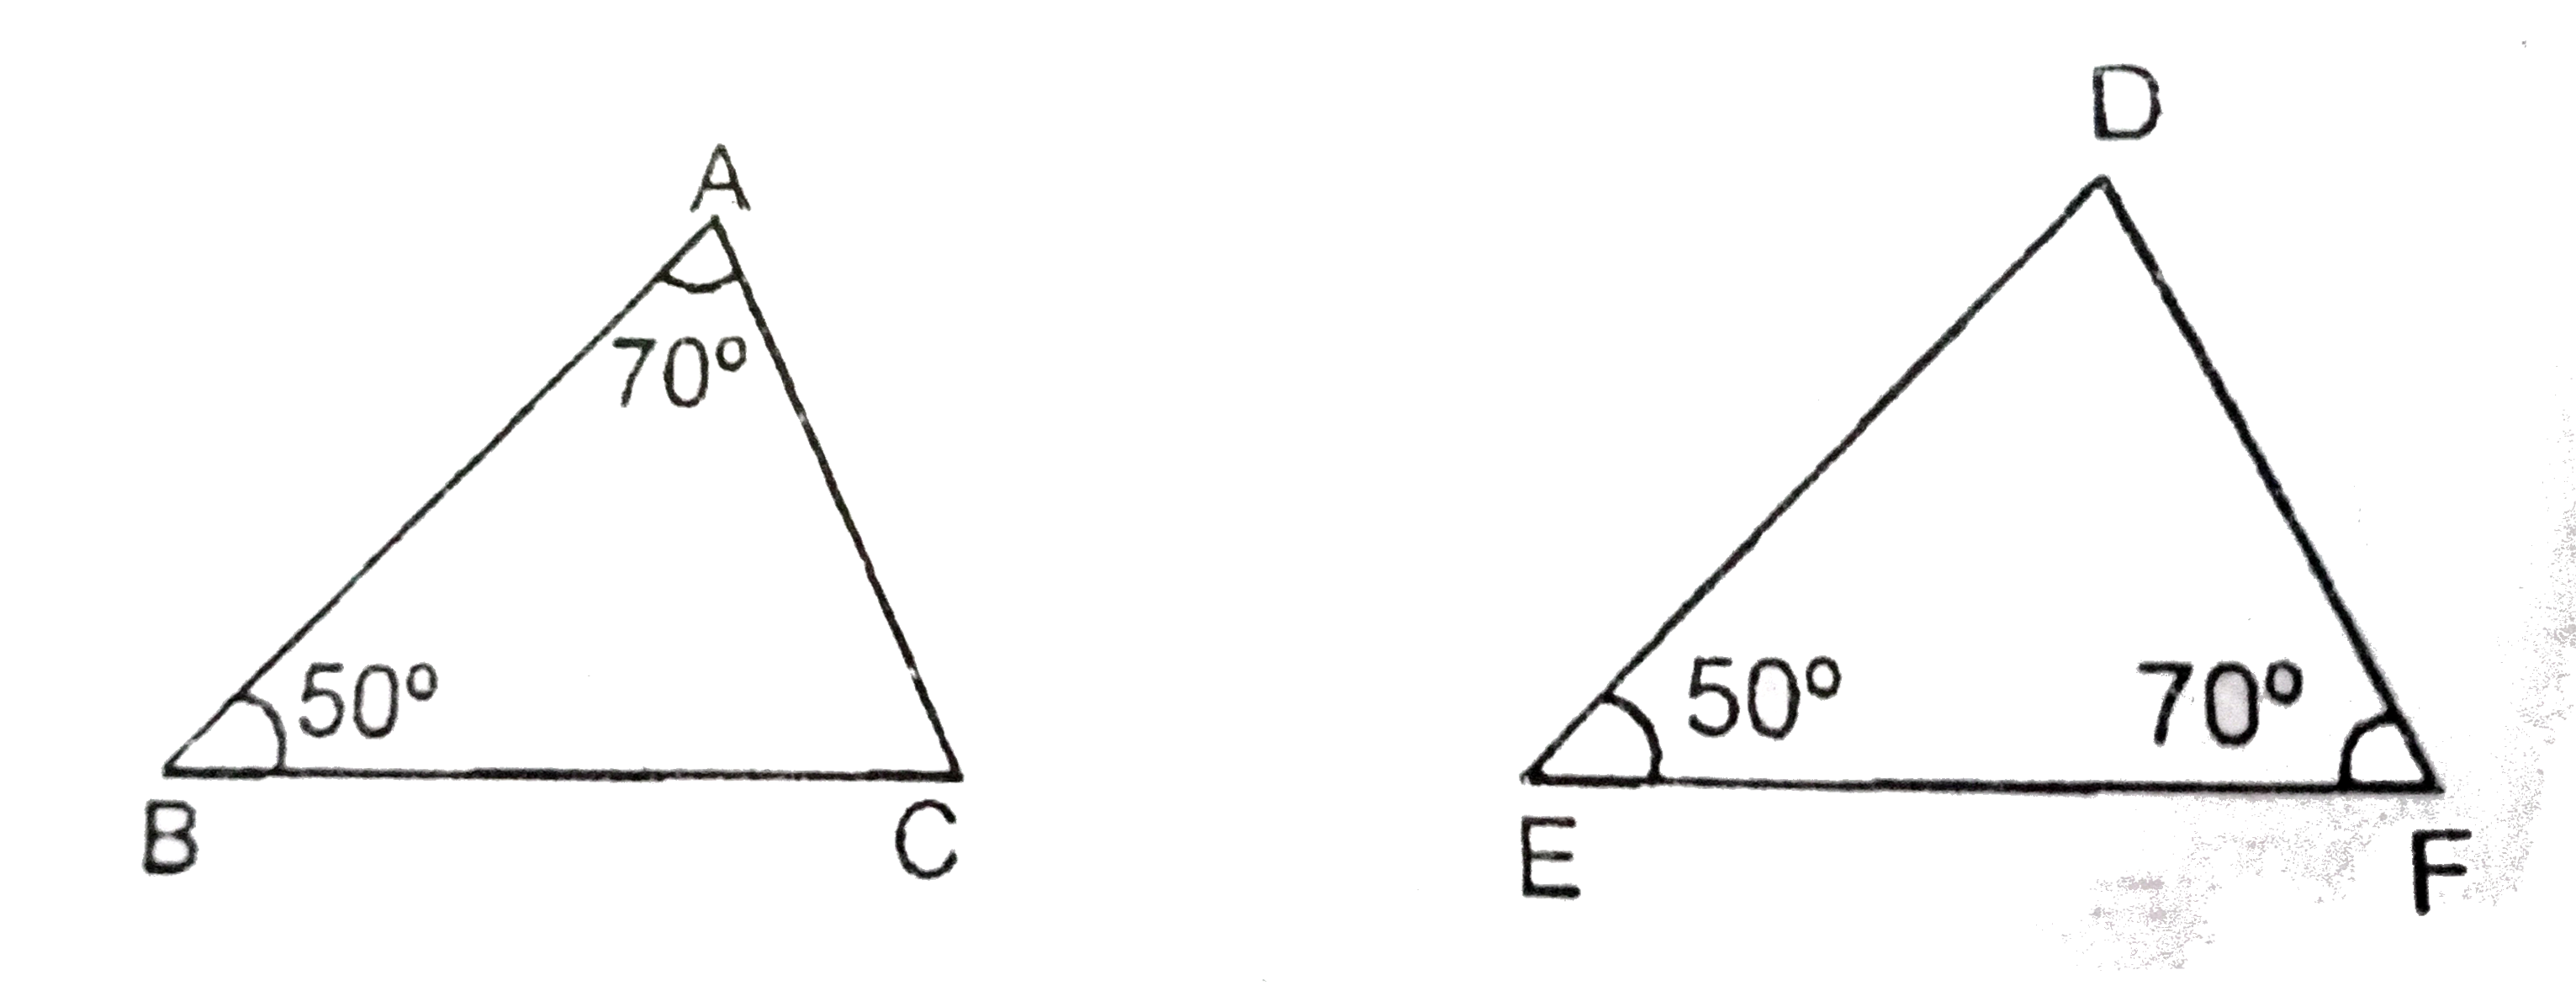
View Solutionबताइए कि निम्नलिखित त्रिभुज - युग्मों में कौन समरूप है ? प्रयुक्त समरूपता कसौटी को लिखें साथ ही समरूप त्रिभुज - युग्मों का सांकेतिक रूप ( भुजाओं की लम्बाईयाँ cm में हो) में लिखें ।
(i)
View Solutionकोष्ठक में दिए उपयुक्त शब्द से रिक्त स्थानों को भरें :
2 cm भुजा वाले सभी वर्ग ................. होते है । (सद्रश्य , सर्वागसम , सद्रश्य और सर्वागसम दोनों)
View Solutionरिक्त स्थानों की पूर्ति करें :
sin2θ+cos2θ= ……………..
View Solutionयदि a1b2≠a2b1 तब समीकरण निकाय a1x+b1y+c1=0,a2x+b2y+c2=0 का
View SolutionWhich of the following are correct chain isomers of butane ? (i)
View SolutionDetermine the point of symmetry of a regular hexagon.
View SolutionDtermine the images of the following figure about the given line :
View SolutionMatch the following Column A to Column B

View SolutionMatch the following Column A to Column B

View SolutionMatch the following Column A to Column B

View SolutionThe inequation represented by the graph given below is :
View SolutionThe inequation that best describes the graph given below is _________
View SolutionThe inequation that best describes the following graph is _________
View SolutionWhich inequations represent the shaded region in the given figure
View SolutionMatch the followings (column I with column II)
ltimg src="https://d10lpgp6xz60nq.cloudfront.net/physics_images/NCERT_BIO_XI_C03_E01_011_Q01.png" width="80%"gt
View Solution
