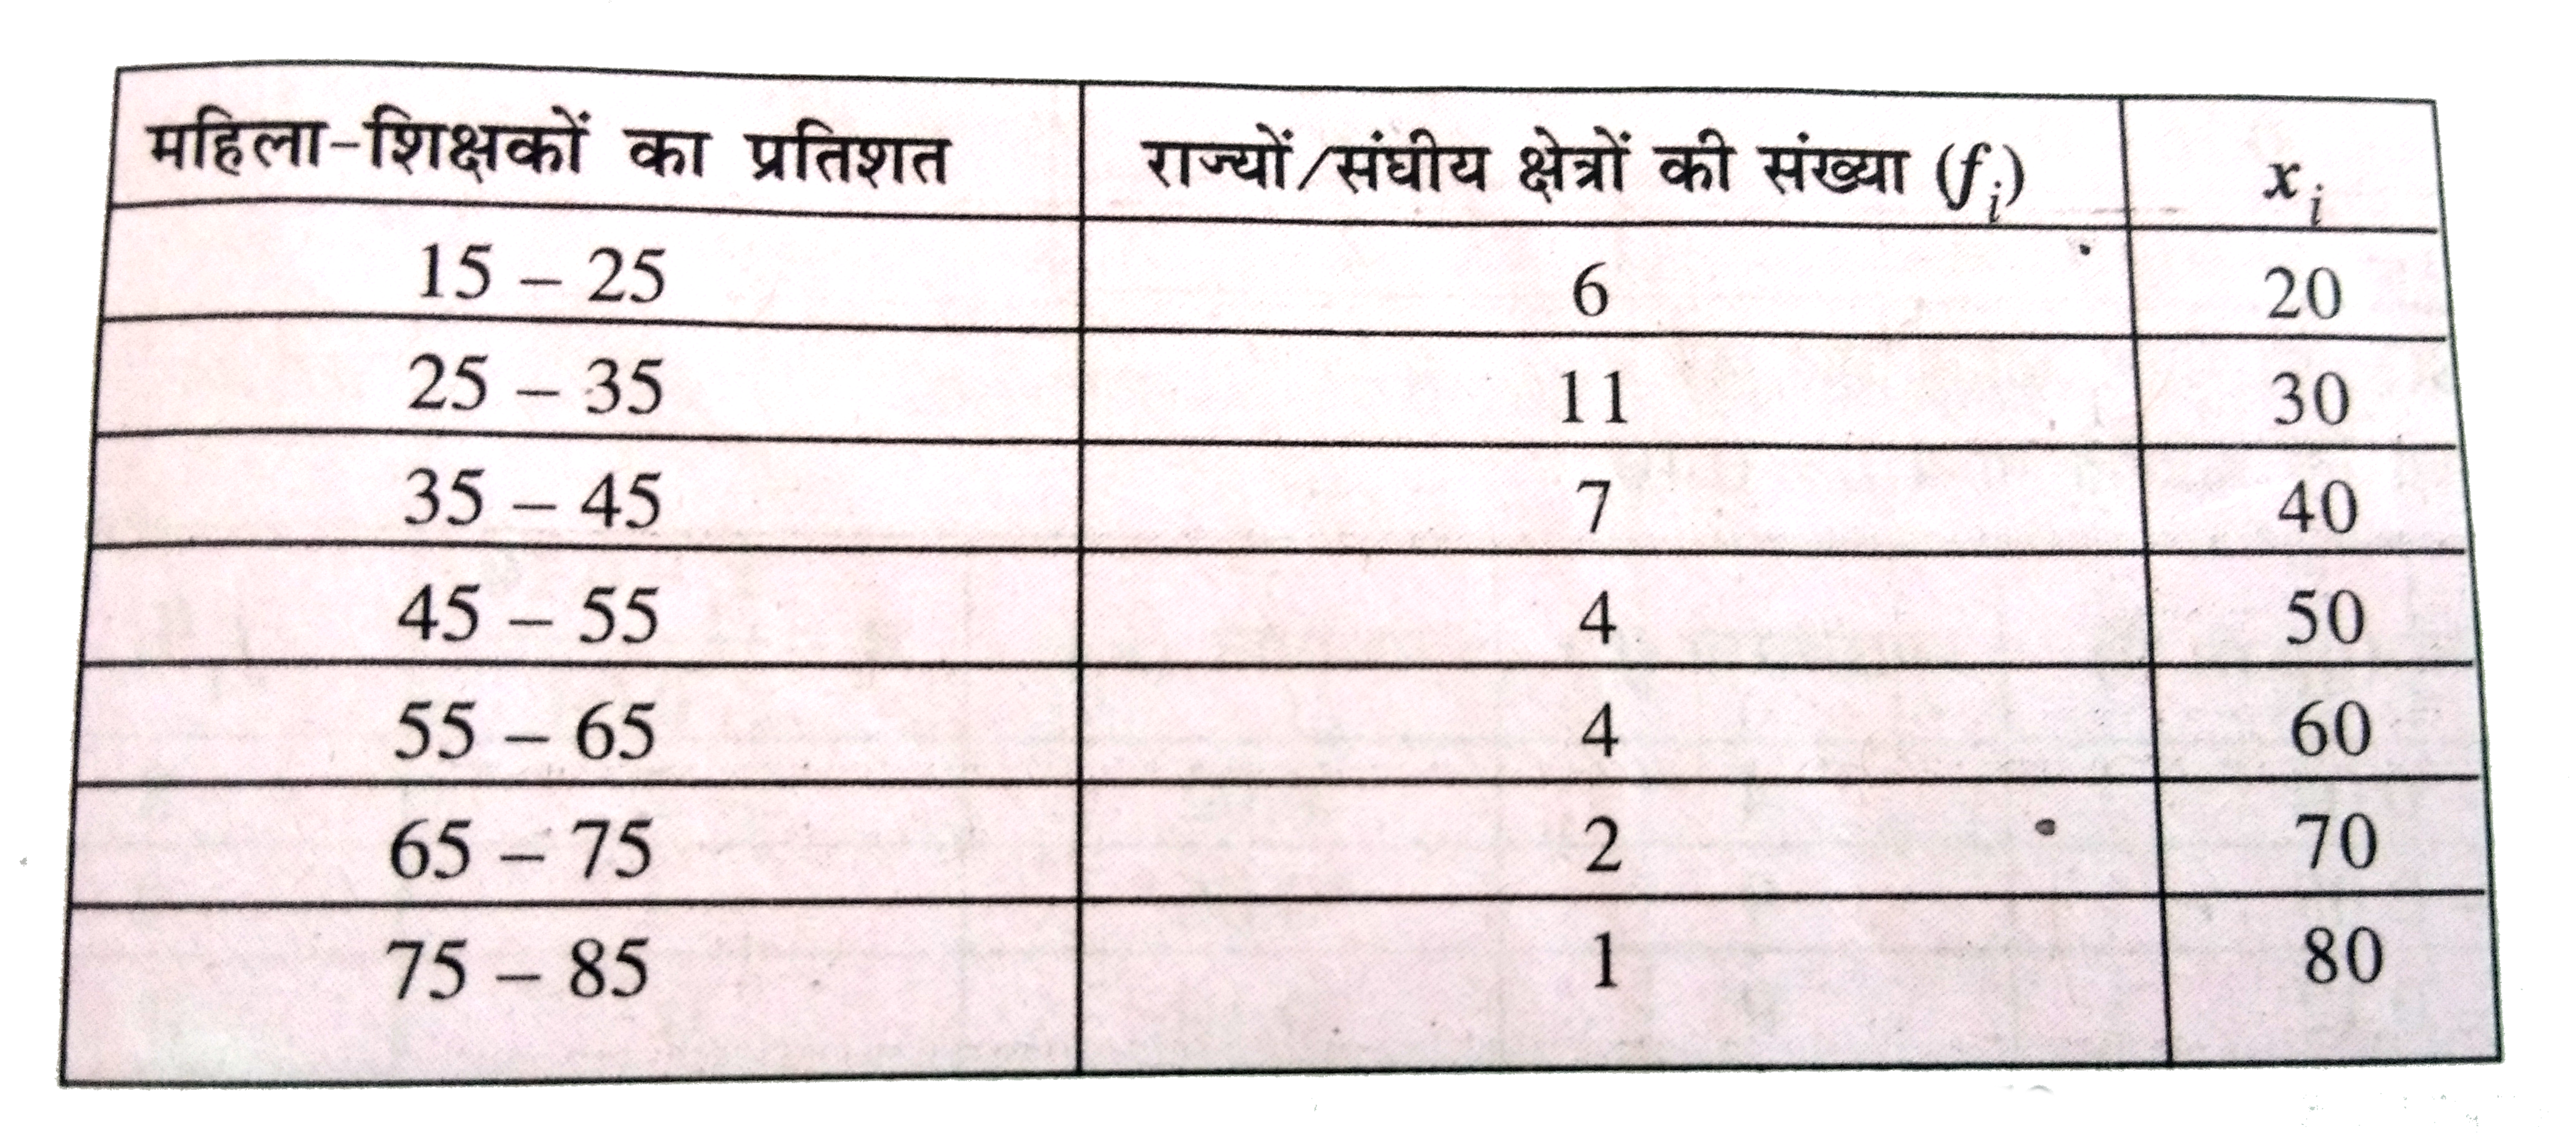
नीचे दी गयी सारणी के विभिन्न राज्यों एवं संघीय क्षेत्रो के ग्रामीण क्षेत्रो के प्राथमिक विधालयो में महिला शिक्षकों के प्रतिशत बंटन को दर्शाता है। तीनो विधियों में महिला शिक्षकों का माध्य प्रतिशत ज्ञात करे।

39.71
34
112
35.30
The correct Answer is:A

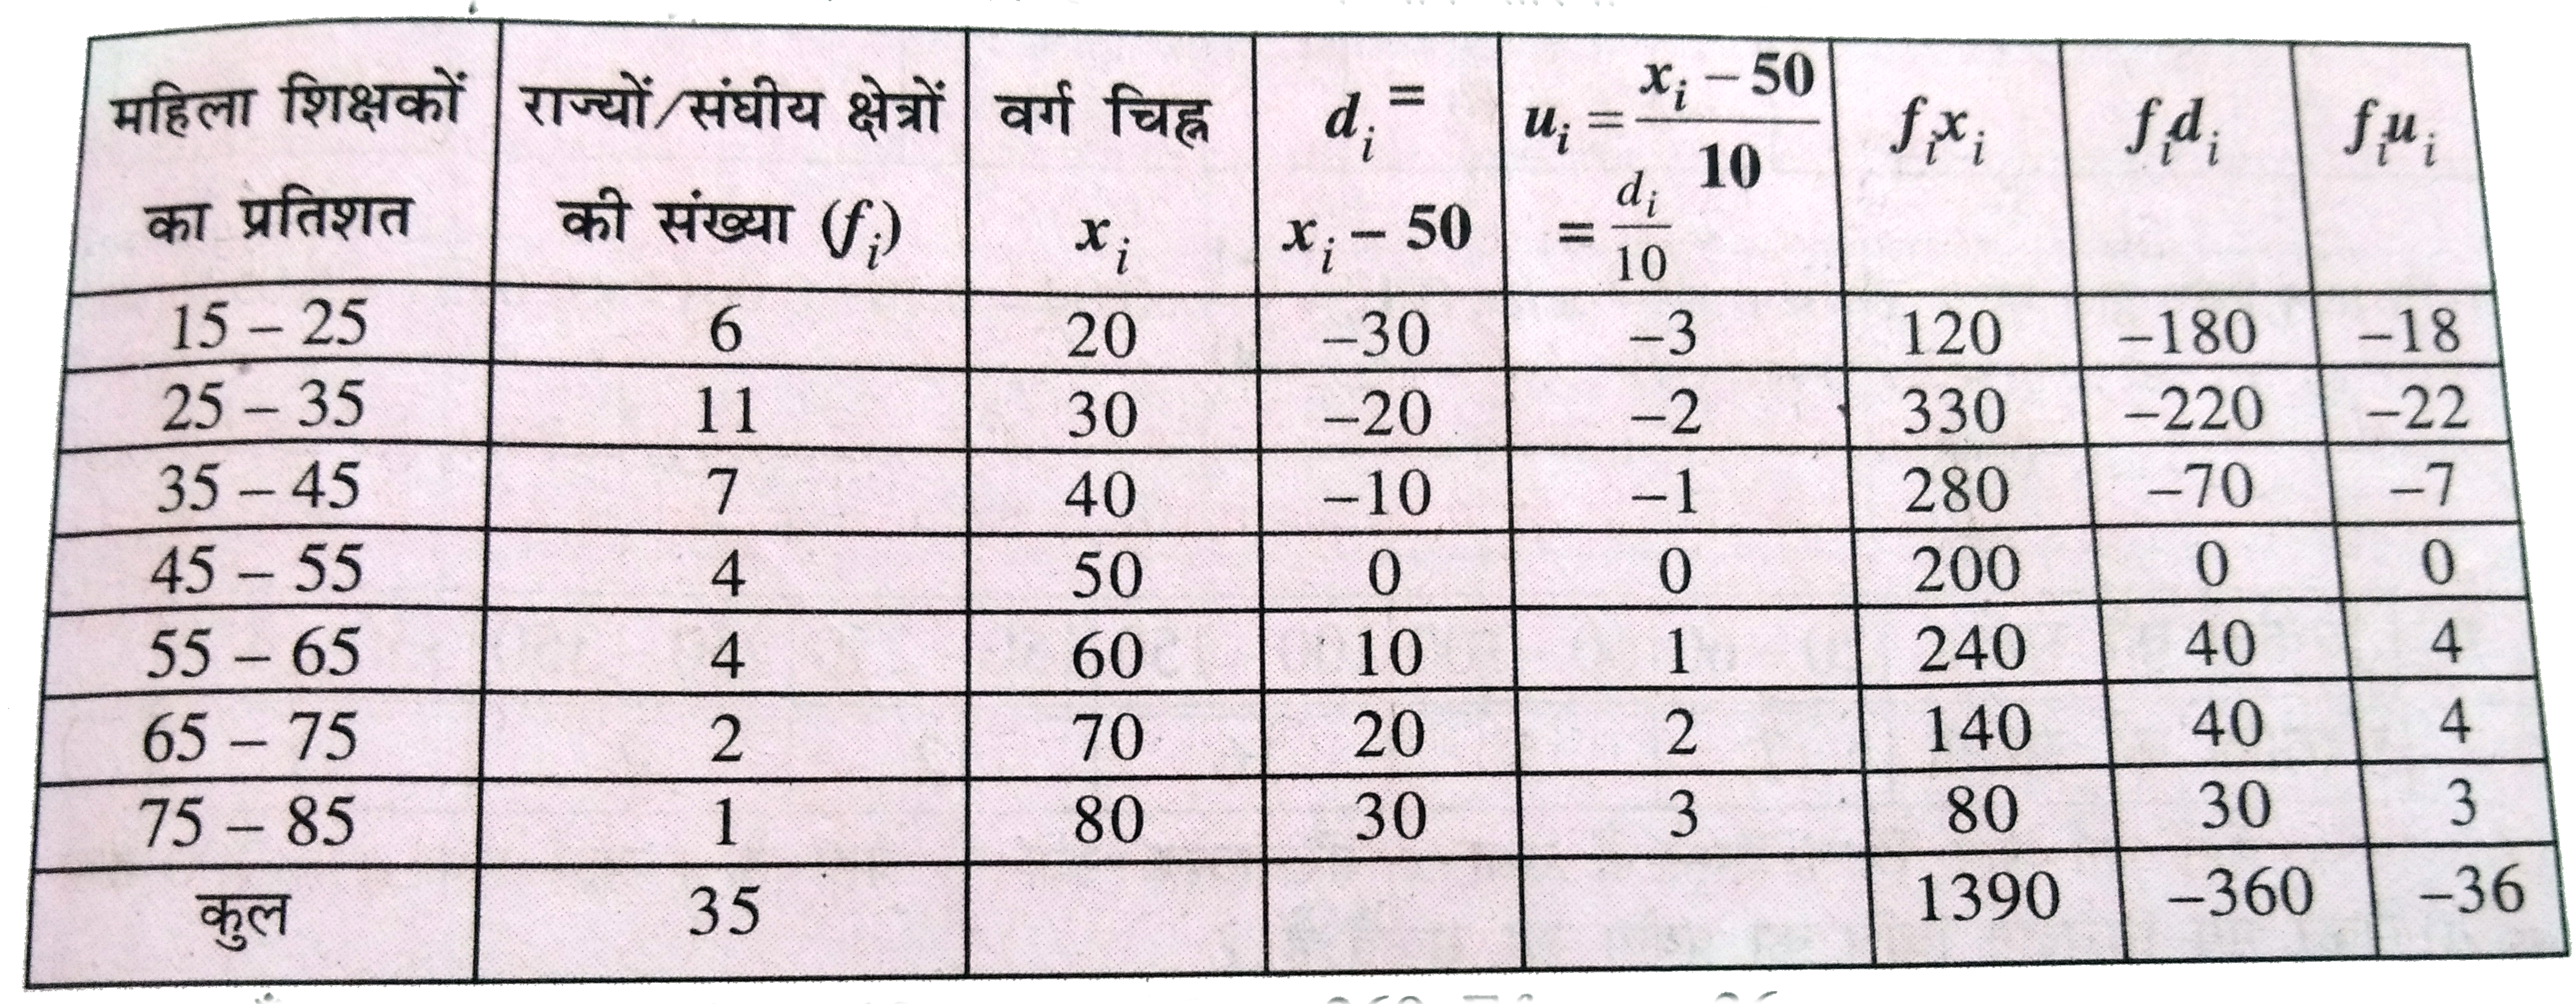
माना कि a=50, h=10, di=xi−50,ui=xi−5010
अब हम di और ui को ज्ञात करते है और इनका मान सारणी में रखते है ।

Σfi=35,Σfixi=1390,Σfi=−360,Σfiui=−36
प्रत्यक्ष विधि से माध्य ¯x=ΣfixiΣfi=139035=39.71
कल्पिक माध्य विधि से माध्य ¯x=a+ΣfiΣfi=50+−36035=39.71
पग-विलचन विधि से माध्य ¯x=a+ΣfiuiΣfi×h=50+−3635×10=39.71
अतः ग्रामीण क्षेत्र में महिला शिक्षकों का प्रतिशत 39.71 है ।
Topper's Solved these Questions
Similar Questions
11 परिणामो का माध्य 30 है । यदि प्रथम 6 परिणामो का माध्य 28 है और अंतिम 6 परिणामो का माध्य 32 हो, तो 6 ठी परिणामो को ज्ञात करे ।
06:07View Solutionनिम्नलिखित आंकड़ों का बहुलक ज्ञात कीजिये।
64, 61, 62, 62,63, 64, 64, 60, 65, 63, 64, 65, 66, 6402:11View Solutionयदि A.P. का nवाँ पद 3n + 5 हैं तो इसका सार्वअंतर होगा।
01:31View SolutionWhich of the following are correct chain isomers of butane ? (i)
02:45View SolutionDetermine the point of symmetry of a regular hexagon.
02:17View SolutionDtermine the images of the following figure about the given line :
05:41View SolutionMatch the following Column A to Column B
 02:10View Solution
Match the following Column A to Column B
 02:17View Solution
Match the following Column A to Column B
 02:10View Solution
The inequation represented by the graph given below is :
02:37View SolutionThe inequation that best describes the graph given below is _________
01:13:48View SolutionThe inequation that best describes the following graph is _________
01:08:48View Solutionकिसी विद्यालय के शिक्षकों के भार किलोग्राम में नीचे दिए गए हैं। इन्हें बारंबारता सारणी में प्रकट कीजिए:
65,62,61, 65,62,70,62,70,75,72,70,60, 80,85,63,85,67,80,75,65.02:23View Solutionआवर्त सारणी में तत्वों के गुणों का क्रम एवं प्रशनोत्री
02:45View Solutionआवर्त सारणी में तत्वों के गुणों का क्रम एवं प्रशनोत्री
02:30View SolutionThe table below indicates the percentage of students and the ratio of boys and girls in the various streams of a college. (Total students = 2600) नीचे दी गयी तालिका छात्रों का प्रतिशत तथा कॉलेज के विभिन्न विषयों में लड़कों तथा लड़कियों का अनुपात दर्शाती है | ( कुल छात्र = 2600 ) In which stream, is the difference in the percentage of boys and girls minimum? किस विषय में, लड़कों एवं लड़कियों के प्रतिशत में सबसे कम अंतर है ?
01:54View Solution

