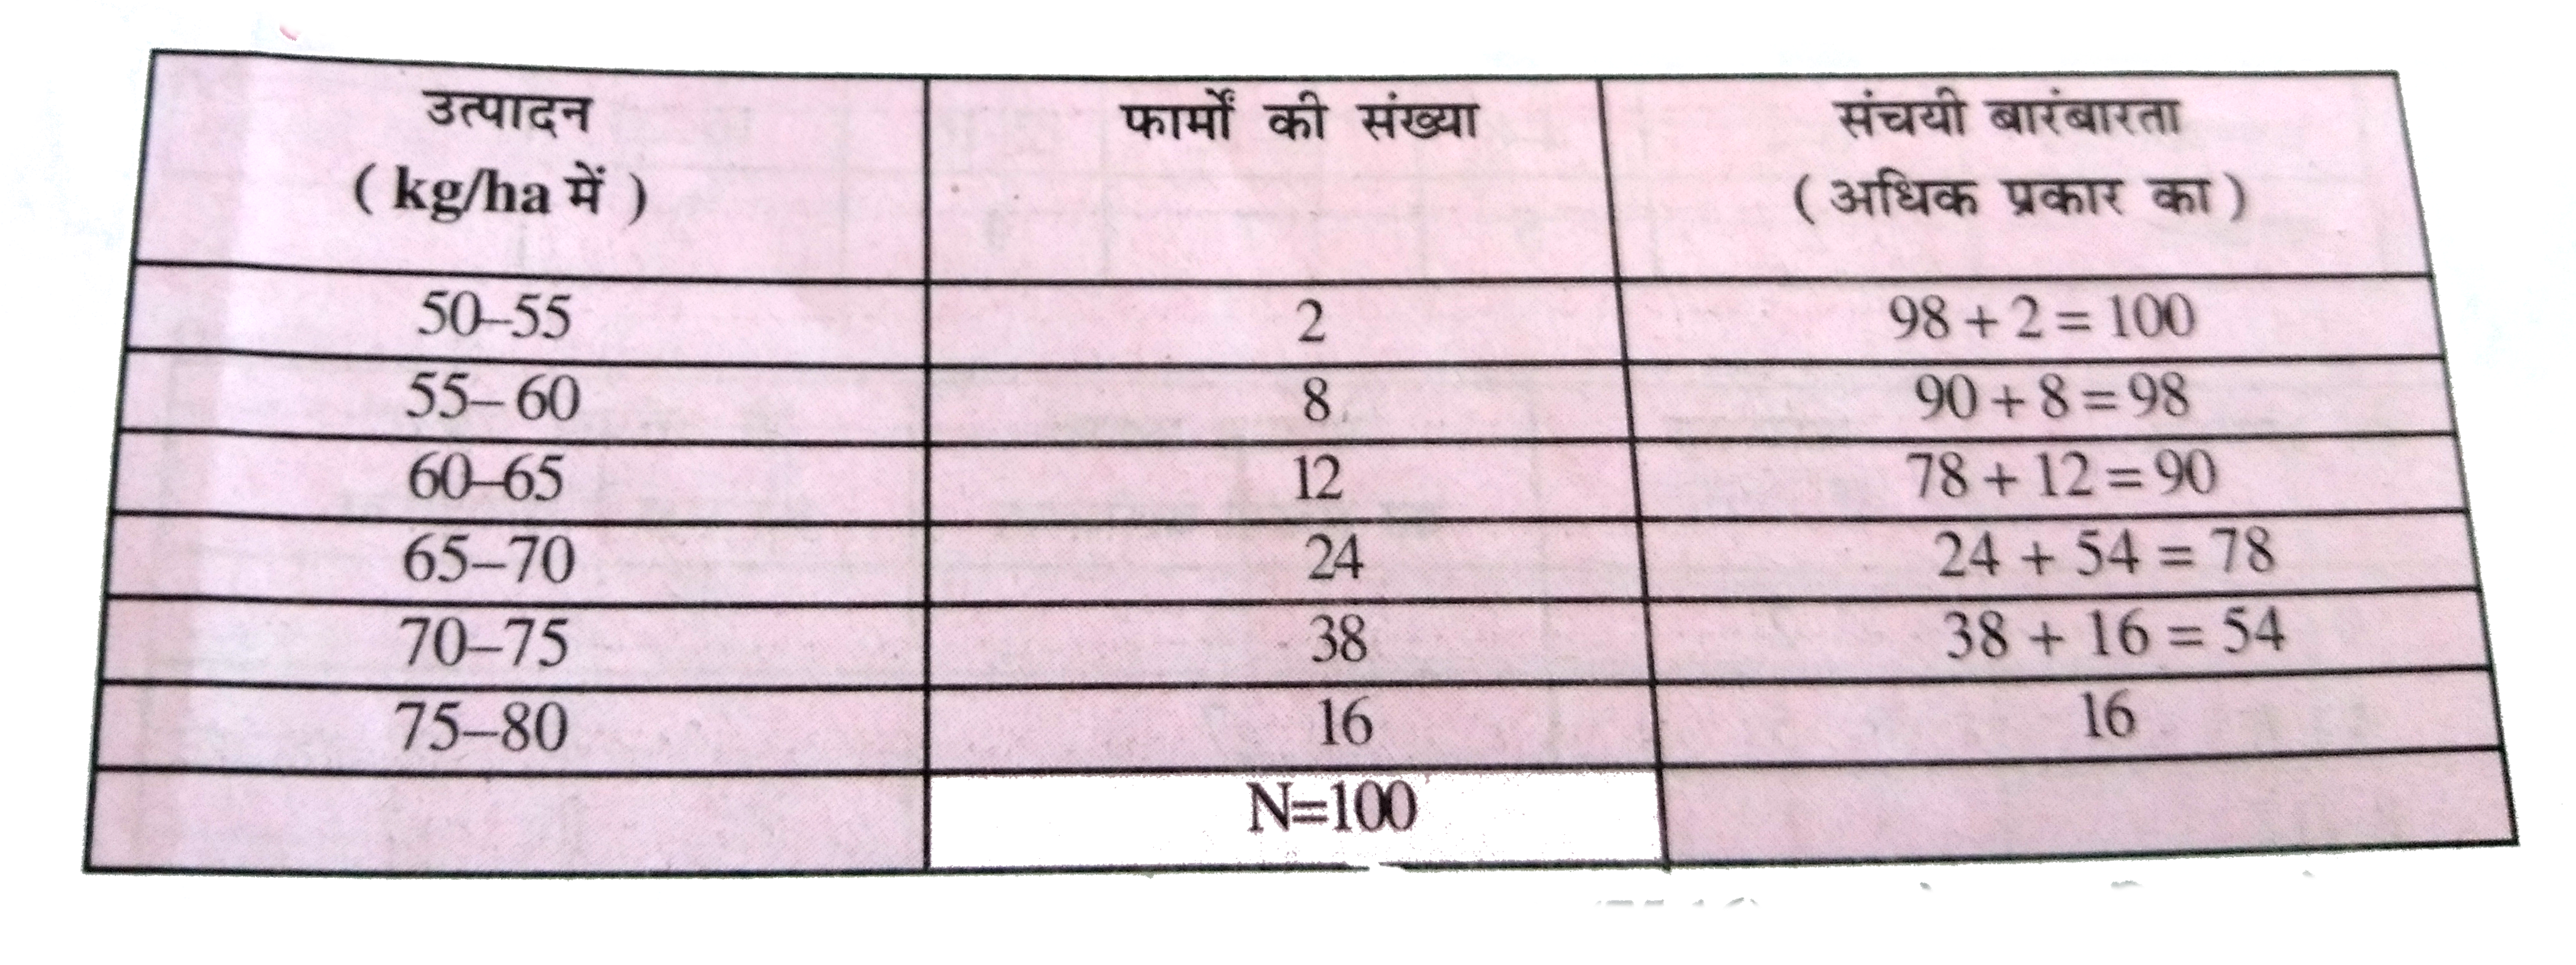
निम्नलिखित सारणी किसी गावं के 100 फर्मो में हुए प्रति हेक्टयर (ha ) गेहूं का उत्पादन दर्शाता हे ।

इस बंटन को 'अधिक प्रकार का ' बंटन में बदलिए और फिर उसका तोरण खीचिए ।

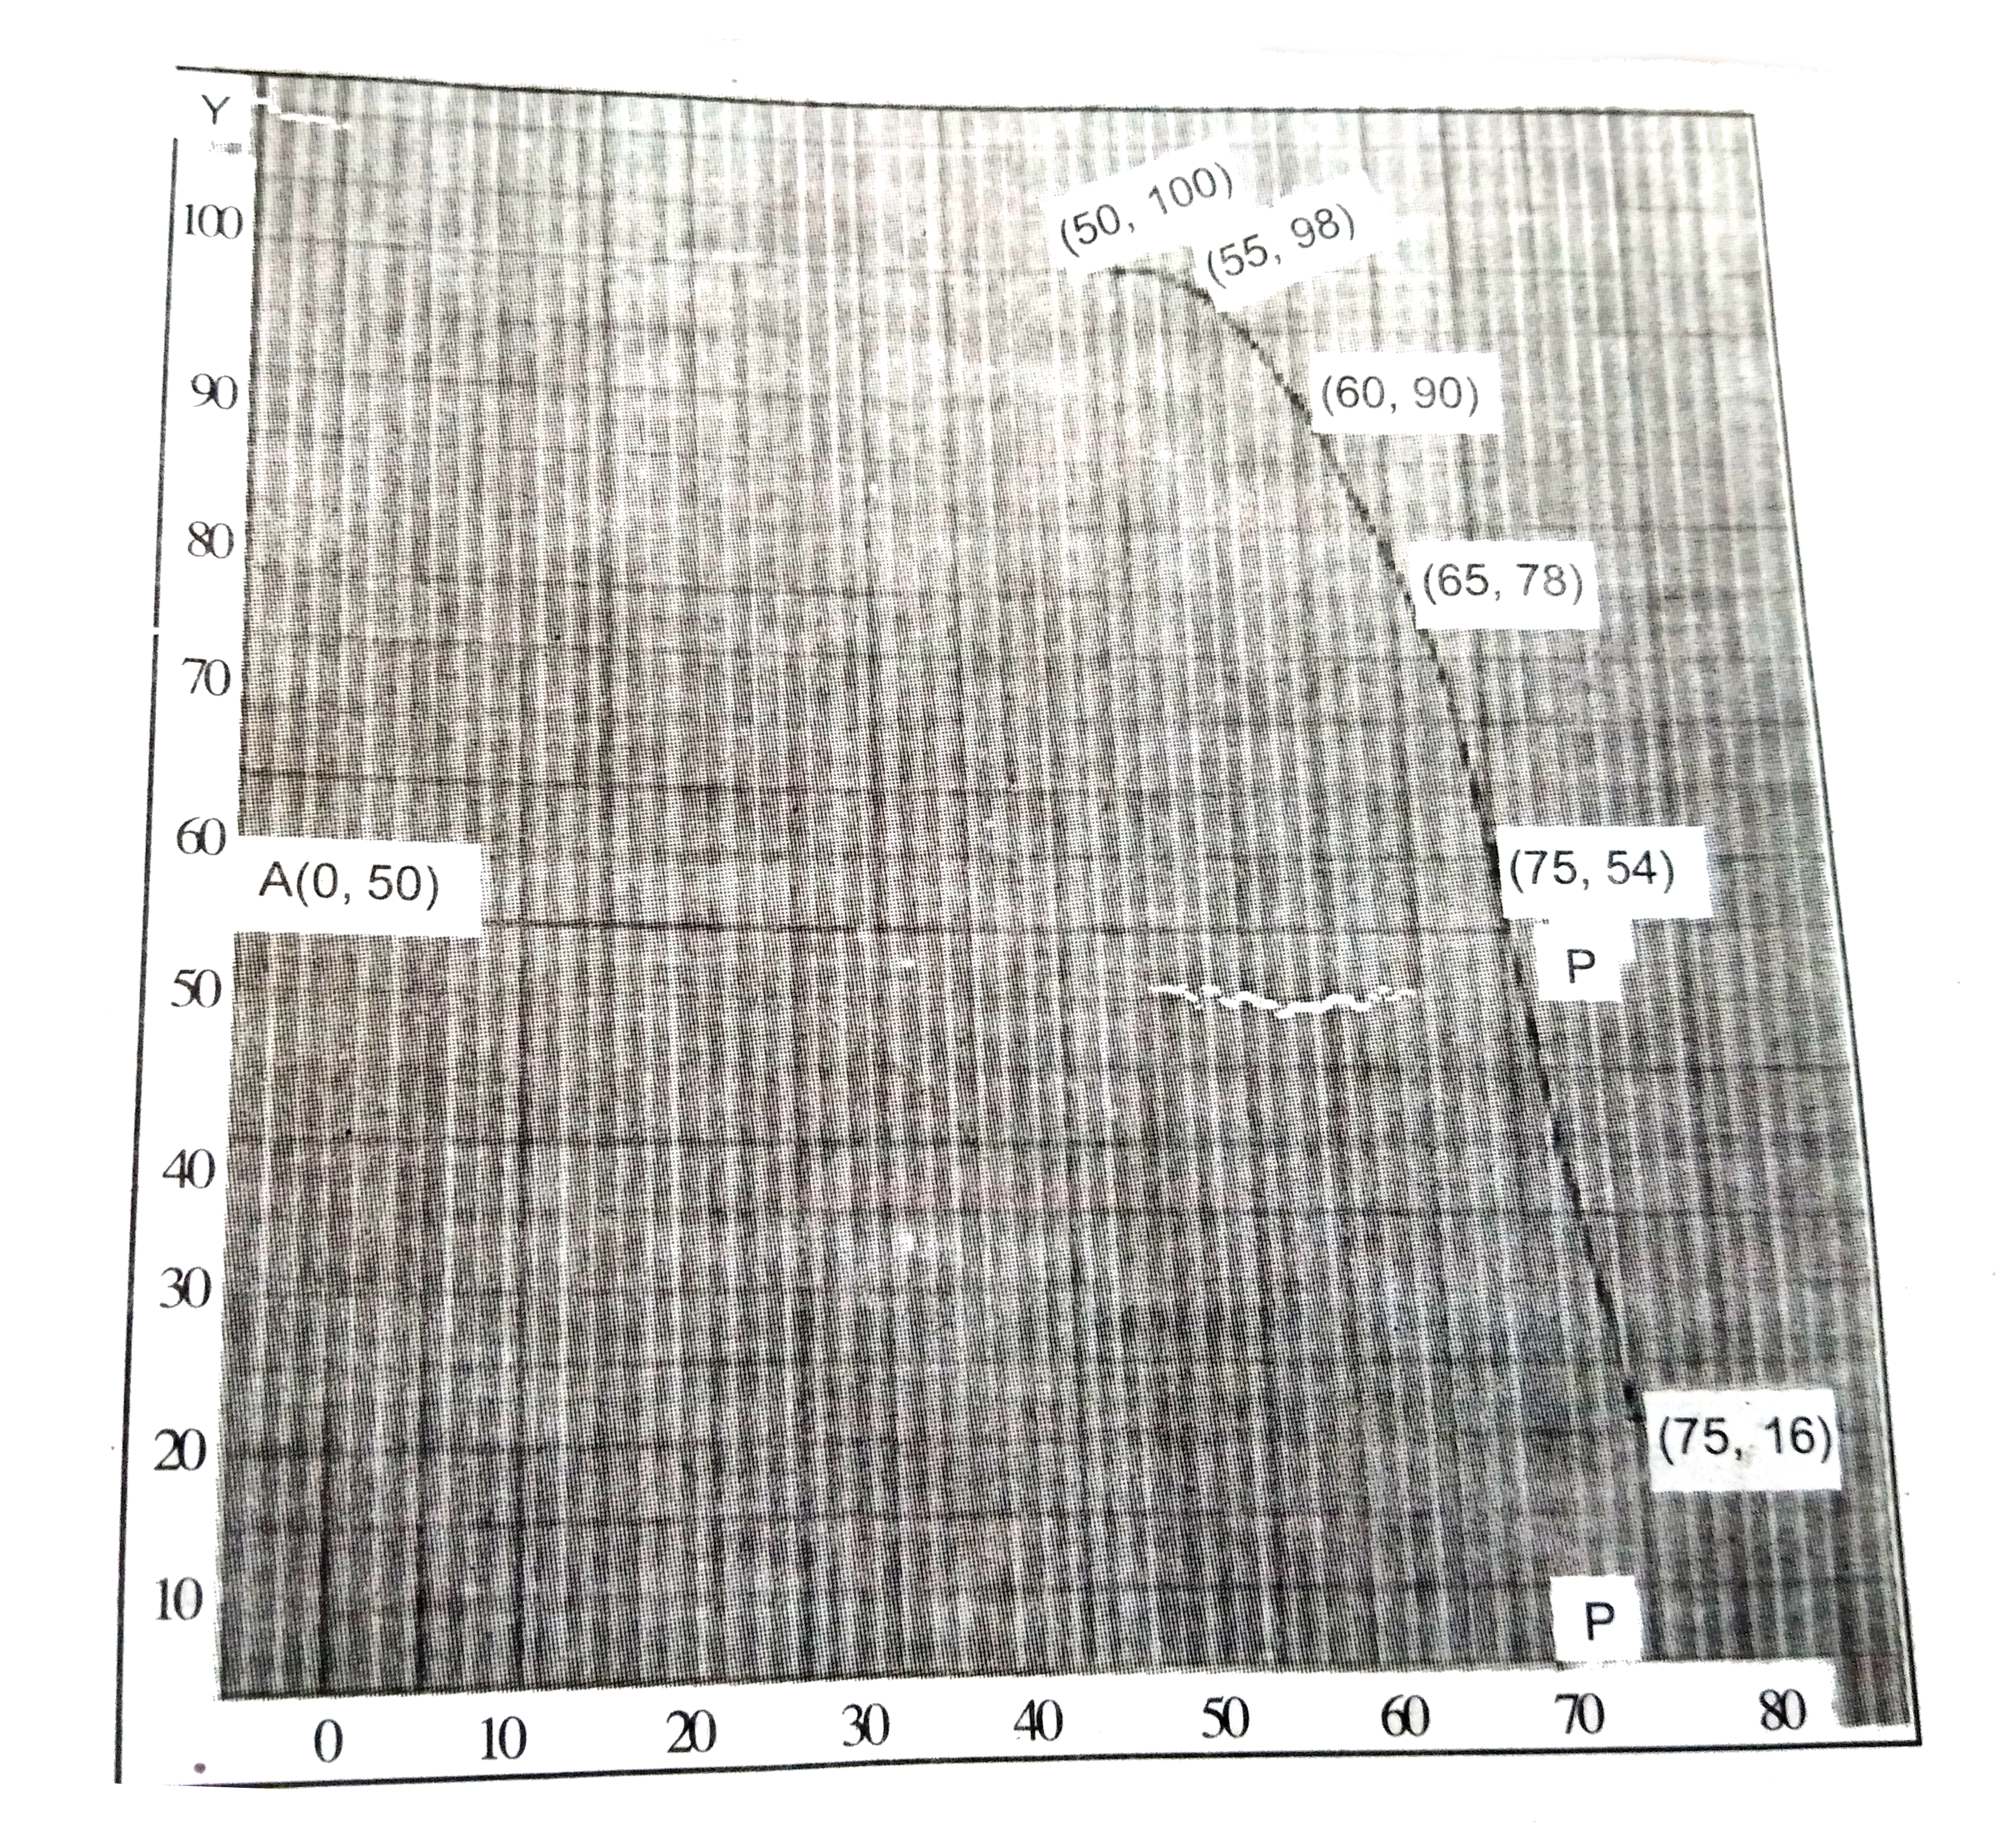
बिंदुओं (50, 100), (55, 98), (60, 90), (65, 78), (70, 54), (75, 16) को आलेख पर अंकित करके मुक्त हस्त से उन्हें मिला देते है । प्राप्त वक्र ही 'अधिक प्रकार का ' बंटन का तोरण होगा जिसे चित्र में दर्शाया गया है ।
यहां N2=1002=50

y - अक्ष बिंदु A(0, 50) लेते है और A से x - अक्ष के समांतर एक रेखा खींचते है , जो ' अधिक प्रकार के ' तोरण को P पर काटता है । P से x - अक्ष पर लम्ब खींचते है जो इसे Q पर काटती है । अब , OQ-70.5(141 छोटे भाग लगभग )
Topper's Solved these Questions
Similar Questions
11 परिणामो का माध्य 30 है । यदि प्रथम 6 परिणामो का माध्य 28 है और अंतिम 6 परिणामो का माध्य 32 हो, तो 6 ठी परिणामो को ज्ञात करे ।
01:37View Solutionनिम्नलिखित आंकड़ों का बहुलक ज्ञात कीजिये।
64, 61, 62, 62,63, 64, 64, 60, 65, 63, 64, 65, 66, 6406:07View Solutionयदि A.P. का nवाँ पद 3n + 5 हैं तो इसका सार्वअंतर होगा।
02:11View SolutionHow many lines of symmetry does the above figure have ?
01:31View SolutionWhich of the following are correct chain isomers of butane ? (i)
02:45View SolutionDetermine the point of symmetry of a regular hexagon.
02:17View SolutionDtermine the images of the following figure about the given line :
05:41View SolutionMatch the following Column A to Column B
 02:21View Solution
Match the following Column A to Column B
 02:03View Solution
Match the following Column A to Column B
 02:10View Solution
Find the area of the figure given below.
 02:17View Solution
The area of the shaded part in the figure given below is ______.
 02:10View Solution
The inequation represented by the graph given below is :
04:23View SolutionThe inequation that best describes the graph given below is _________
01:13View SolutionThe inequation that best describes the following graph is _________
03:12View SolutionWhich inequations represent the shaded region in the given figure
05:46View Solution

