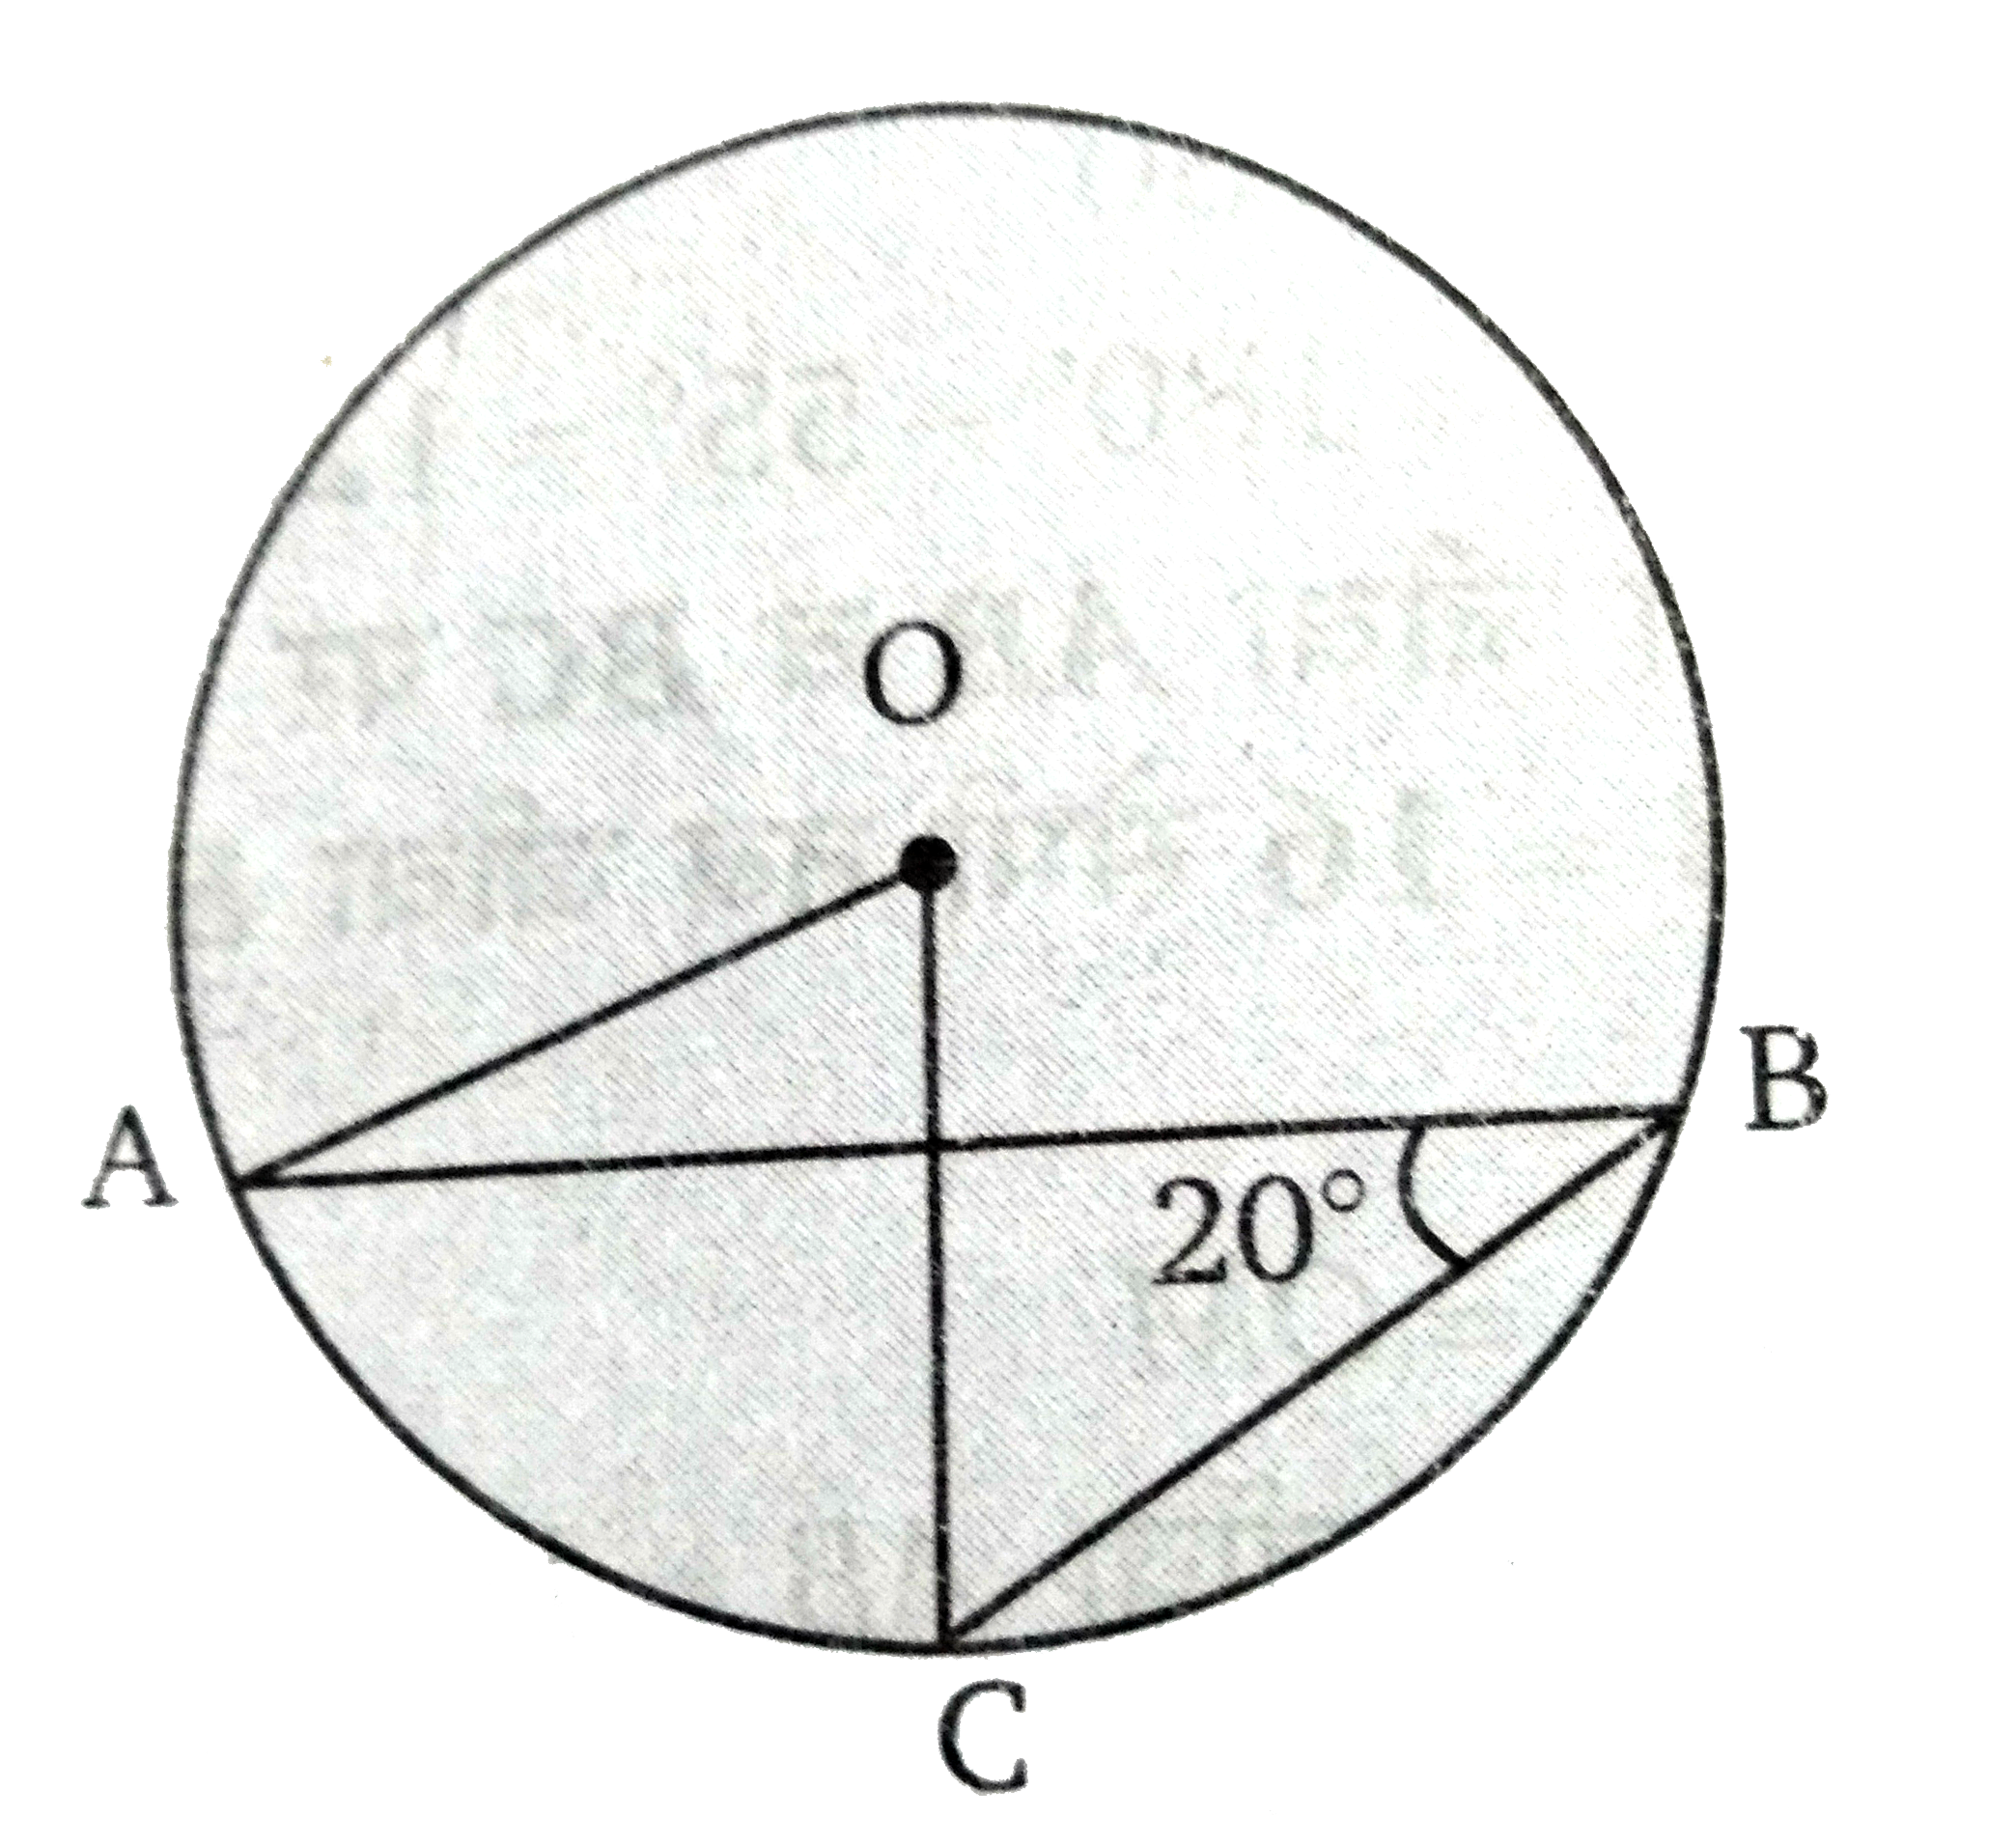
चित्र में O , वृत्त का केन्द्र है। यदि तो का मान ज्ञात कीजिए।

इनमे से कोई नहीं
The correct Answer is:C
Topper's Solved these Questions
- वृत्त BOOK - BALAJI PUBLICATIONCHAPTER - वृत्त EXERCISE - अभ्यास 15.1 (अतिलघु उत्तरीय प्रश्न)
8 Videos
- वृत्त BOOK - BALAJI PUBLICATIONCHAPTER - वृत्त EXERCISE - अभ्यास 15.1 (लघु उत्तरीय प्रश्न-I)
2 Videos
- वास्तविक संख्याओं के घातांक BOOK - BALAJI PUBLICATIONCHAPTER - वास्तविक संख्याओं के घातांक EXERCISE - स्वमूल्याकन परीक्षण
13 Videos
- शेषफल प्रमेय तथा गुणनखण्ड प्रमेय BOOK - BALAJI PUBLICATIONCHAPTER - शेषफल प्रमेय तथा गुणनखण्ड प्रमेय EXERCISE - स्वमूल्यांकन परिक्षण
20 Videos
Similar Questions
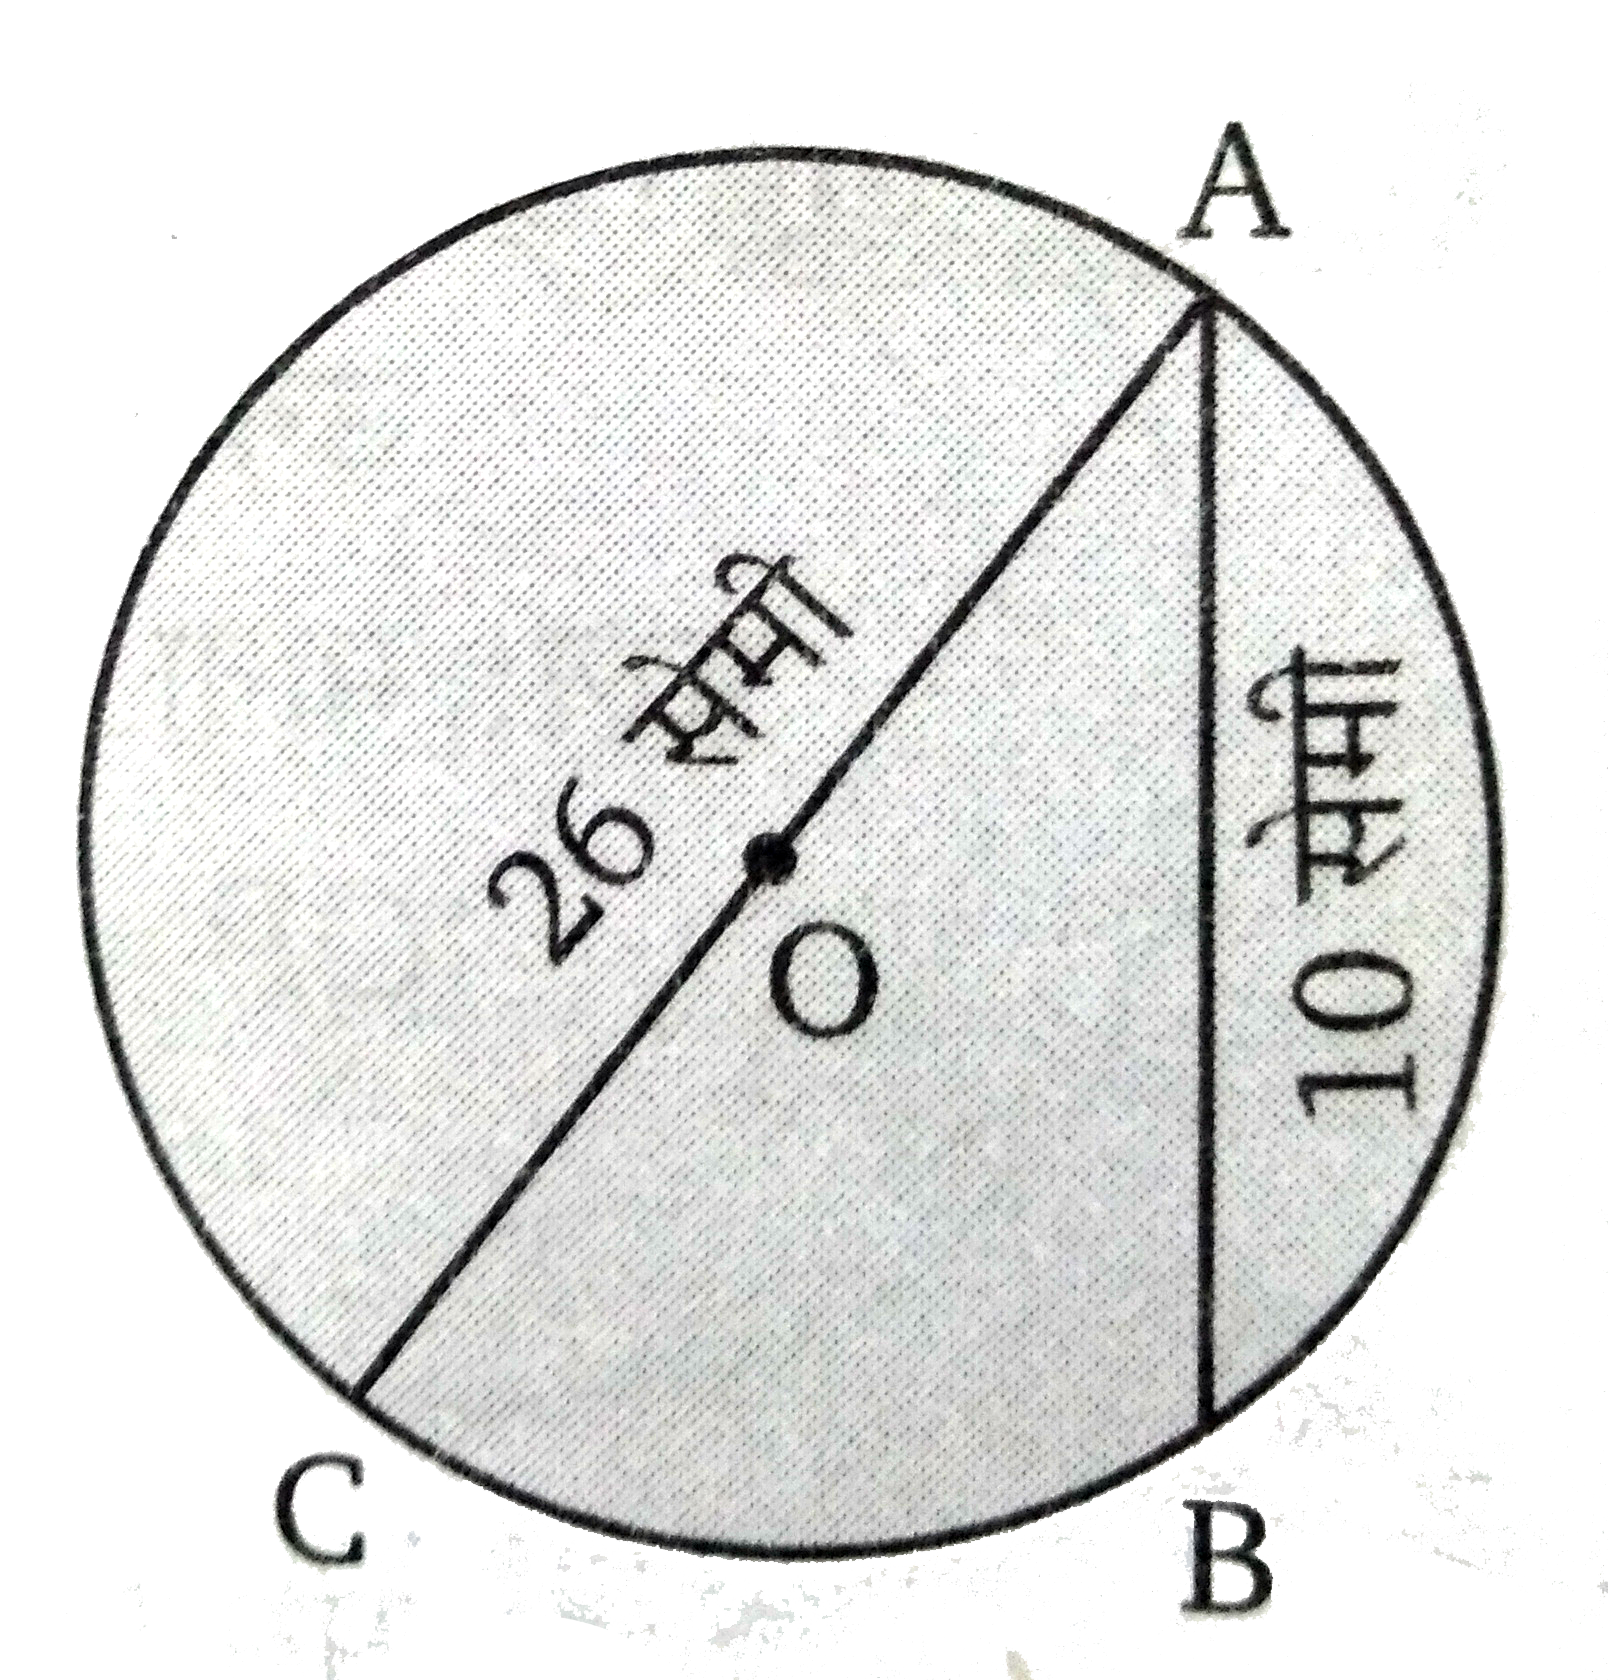
चित्र में O , वृत्त का केन्द्र, जीवा AB = 10 सेमी तथा व्यास AC = 26 सेमी है। जीवा AB की वृत्त के केन्द्र से दूरी ज्ञात कीजिए।

View Solutionएक 5 सेमी त्रिज्या वाले वृत्त के केन्द्र से 8 सेमी की एक जीवा की दूरी ज्ञात कीजिए।
View Solutionनिम्न का सरलीकरण कीजिए-
(24332)−4/5
View Solutionx3+3x2+3x+1 को 5+2x से भाग करने पर शेषफल ज्ञात कीजिए।
View SolutionIdentify the cell organelle 'A' :-
ltimg src="https://d10lpgp6xz60nq.cloudfront.net/physics_images/ALN_BIO_C10_E08_018_Q01.png" width="80%"gt
View SolutionHow many lines of symmetry does the above figure have ?
View SolutionWhich of the following are correct chain isomers of butane ? (i)
View SolutionDetermine the point of symmetry of a regular hexagon.
View SolutionDtermine the images of the following figure about the given line :
View SolutionIn the following figure, AB and BC are equidistant from the centre 'O' of the Show that
(a) ABC is an isosceles triangle.
(b) OB bisects angle ABC.
ltimg src="https://d10lpgp6xz60nq.cloudfront.net/physics_images/PS_MATH_X_C13_E02_006_Q01.png" width="80%"gt
View SolutionIn the given figure, AB is a diameter, O is the center of the circle and ∠OCB=50∘ then find ∠DBC.
View SolutionMatch the following Column A to Column B

View SolutionMatch the following Column A to Column B

View SolutionMatch the following Column A to Column B

View SolutionThe inequation represented by the graph given below is :
View SolutionThe inequation that best describes the graph given below is _________
View Solution
