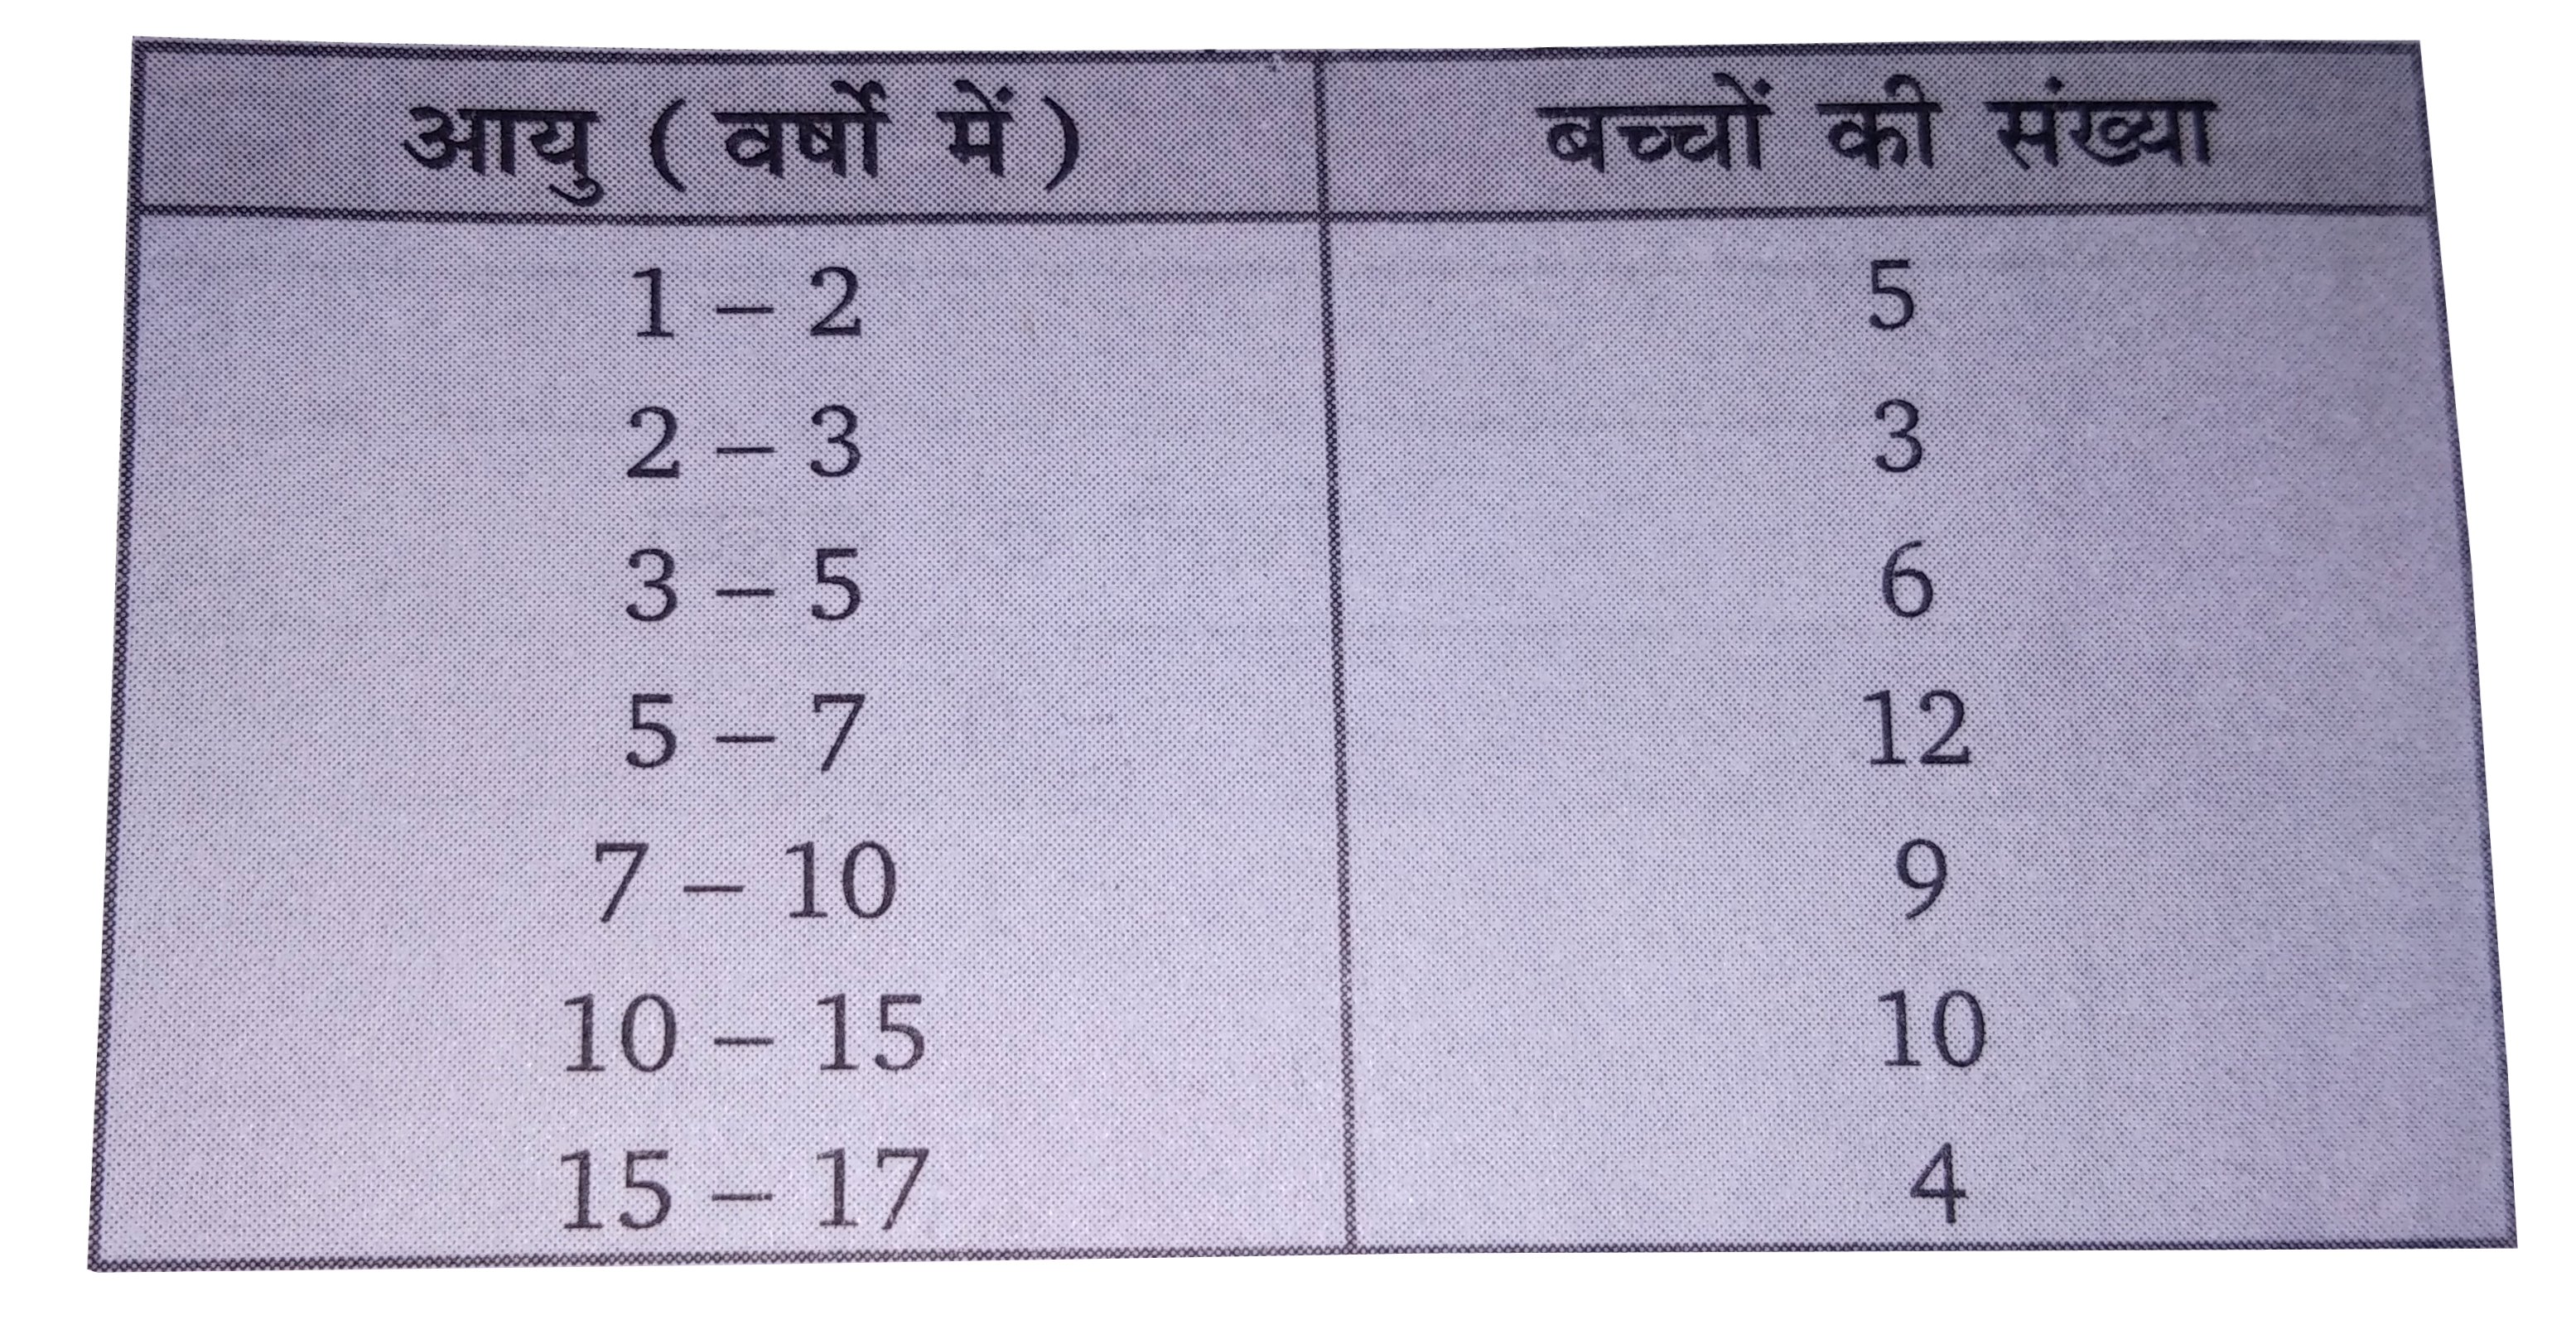
एक पार्क में खेल रहे विभिन्न आयु वर्गों के बच्चों की संख्या का एक यादृच्छिक सर्वेक्षण करने पर निम्नलिखित आँकड़े प्राप्त हुए :

ऊपर दिए गए आँकड़ों को निरूपित करने वाला एक आयत चित्र खींचिए।
Step by step video & image solution for एक पार्क में खेल रहे विभिन्न आयु वर्गों के बच्चों की संख्या का एक यादृच्छिक सर्वेक्षण करने पर निम्नलिखित आँकड़े प्राप्त हुए : ऊपर दिए गए आँकड़ों को निरूपित करने वाला एक आयत चित्र खींचिए। by Maths experts to help you in doubts & scoring excellent marks in Class 9 exams.
Topper's Solved these Questions
- BOOK - BALAJI PUBLICATIONCHAPTER - सांख्यिकीEXERCISE - बहुविकल्पीय प्रश्न12videos
सांख्यिकी
- BOOK - BALAJI PUBLICATIONCHAPTER - समांतर चतुर्भुज व त्रिभुज के क्षेत्रफलEXERCISE - स्वमूल्यांकन परीक्षण15videos
समांतर चतुर्भुज व त्रिभुज के क्षेत्रफल
- BOOK - BALAJI PUBLICATIONCHAPTER - हीरोन का सूत्रEXERCISE - स्वमूल्यांकन परीक्षण10videos
हीरोन का सूत्र
Similar Questions
एक बारंबारता बंटन में एक वर्ग का मध्यमान 10 है तथा वर्ग की चौड़ाई 6 है। वर्ग की निम्न सीमा है-
01:37View Solutionएक चतुर्भुज ABCD के विकर्ण AC और BD परस्पर बिंदु O पर इस प्रकार प्रतिच्छेद करते हैं कि (AOD) का क्षे0=(BOC) का क्षे0 तो सिद्ध कीजिए कि ABCD एक समलम्ब चतुर्भुज है।
06:07View Solutionएक त्रिभुज का क्षेत्रफल ज्ञात कीजिए जिसकी दो भुजाएं 8 सेमी और 11 सेमी है तथा परिमाप 32 सेमी है।
02:11View SolutionHow many lines of symmetry does the above figure have ?
01:31View SolutionWhich of the following are correct chain isomers of butane ? (i)
02:45View SolutionDetermine the point of symmetry of a regular hexagon.
02:17View SolutionDtermine the images of the following figure about the given line :
05:41View SolutionMatch the following Column A to Column B
 02:21View Solution
Match the following Column A to Column B
 02:03View Solution
Match the following Column A to Column B
 02:10View Solution
Find the area of the figure given below.
 02:17View Solution
The area of the shaded part in the figure given below is ______.
 02:10View Solution
The inequation represented by the graph given below is :
04:23View SolutionThe inequation that best describes the graph given below is _________
01:13View SolutionThe inequation that best describes the following graph is _________
03:12View SolutionWhich inequations represent the shaded region in the given figure
05:46View Solution

