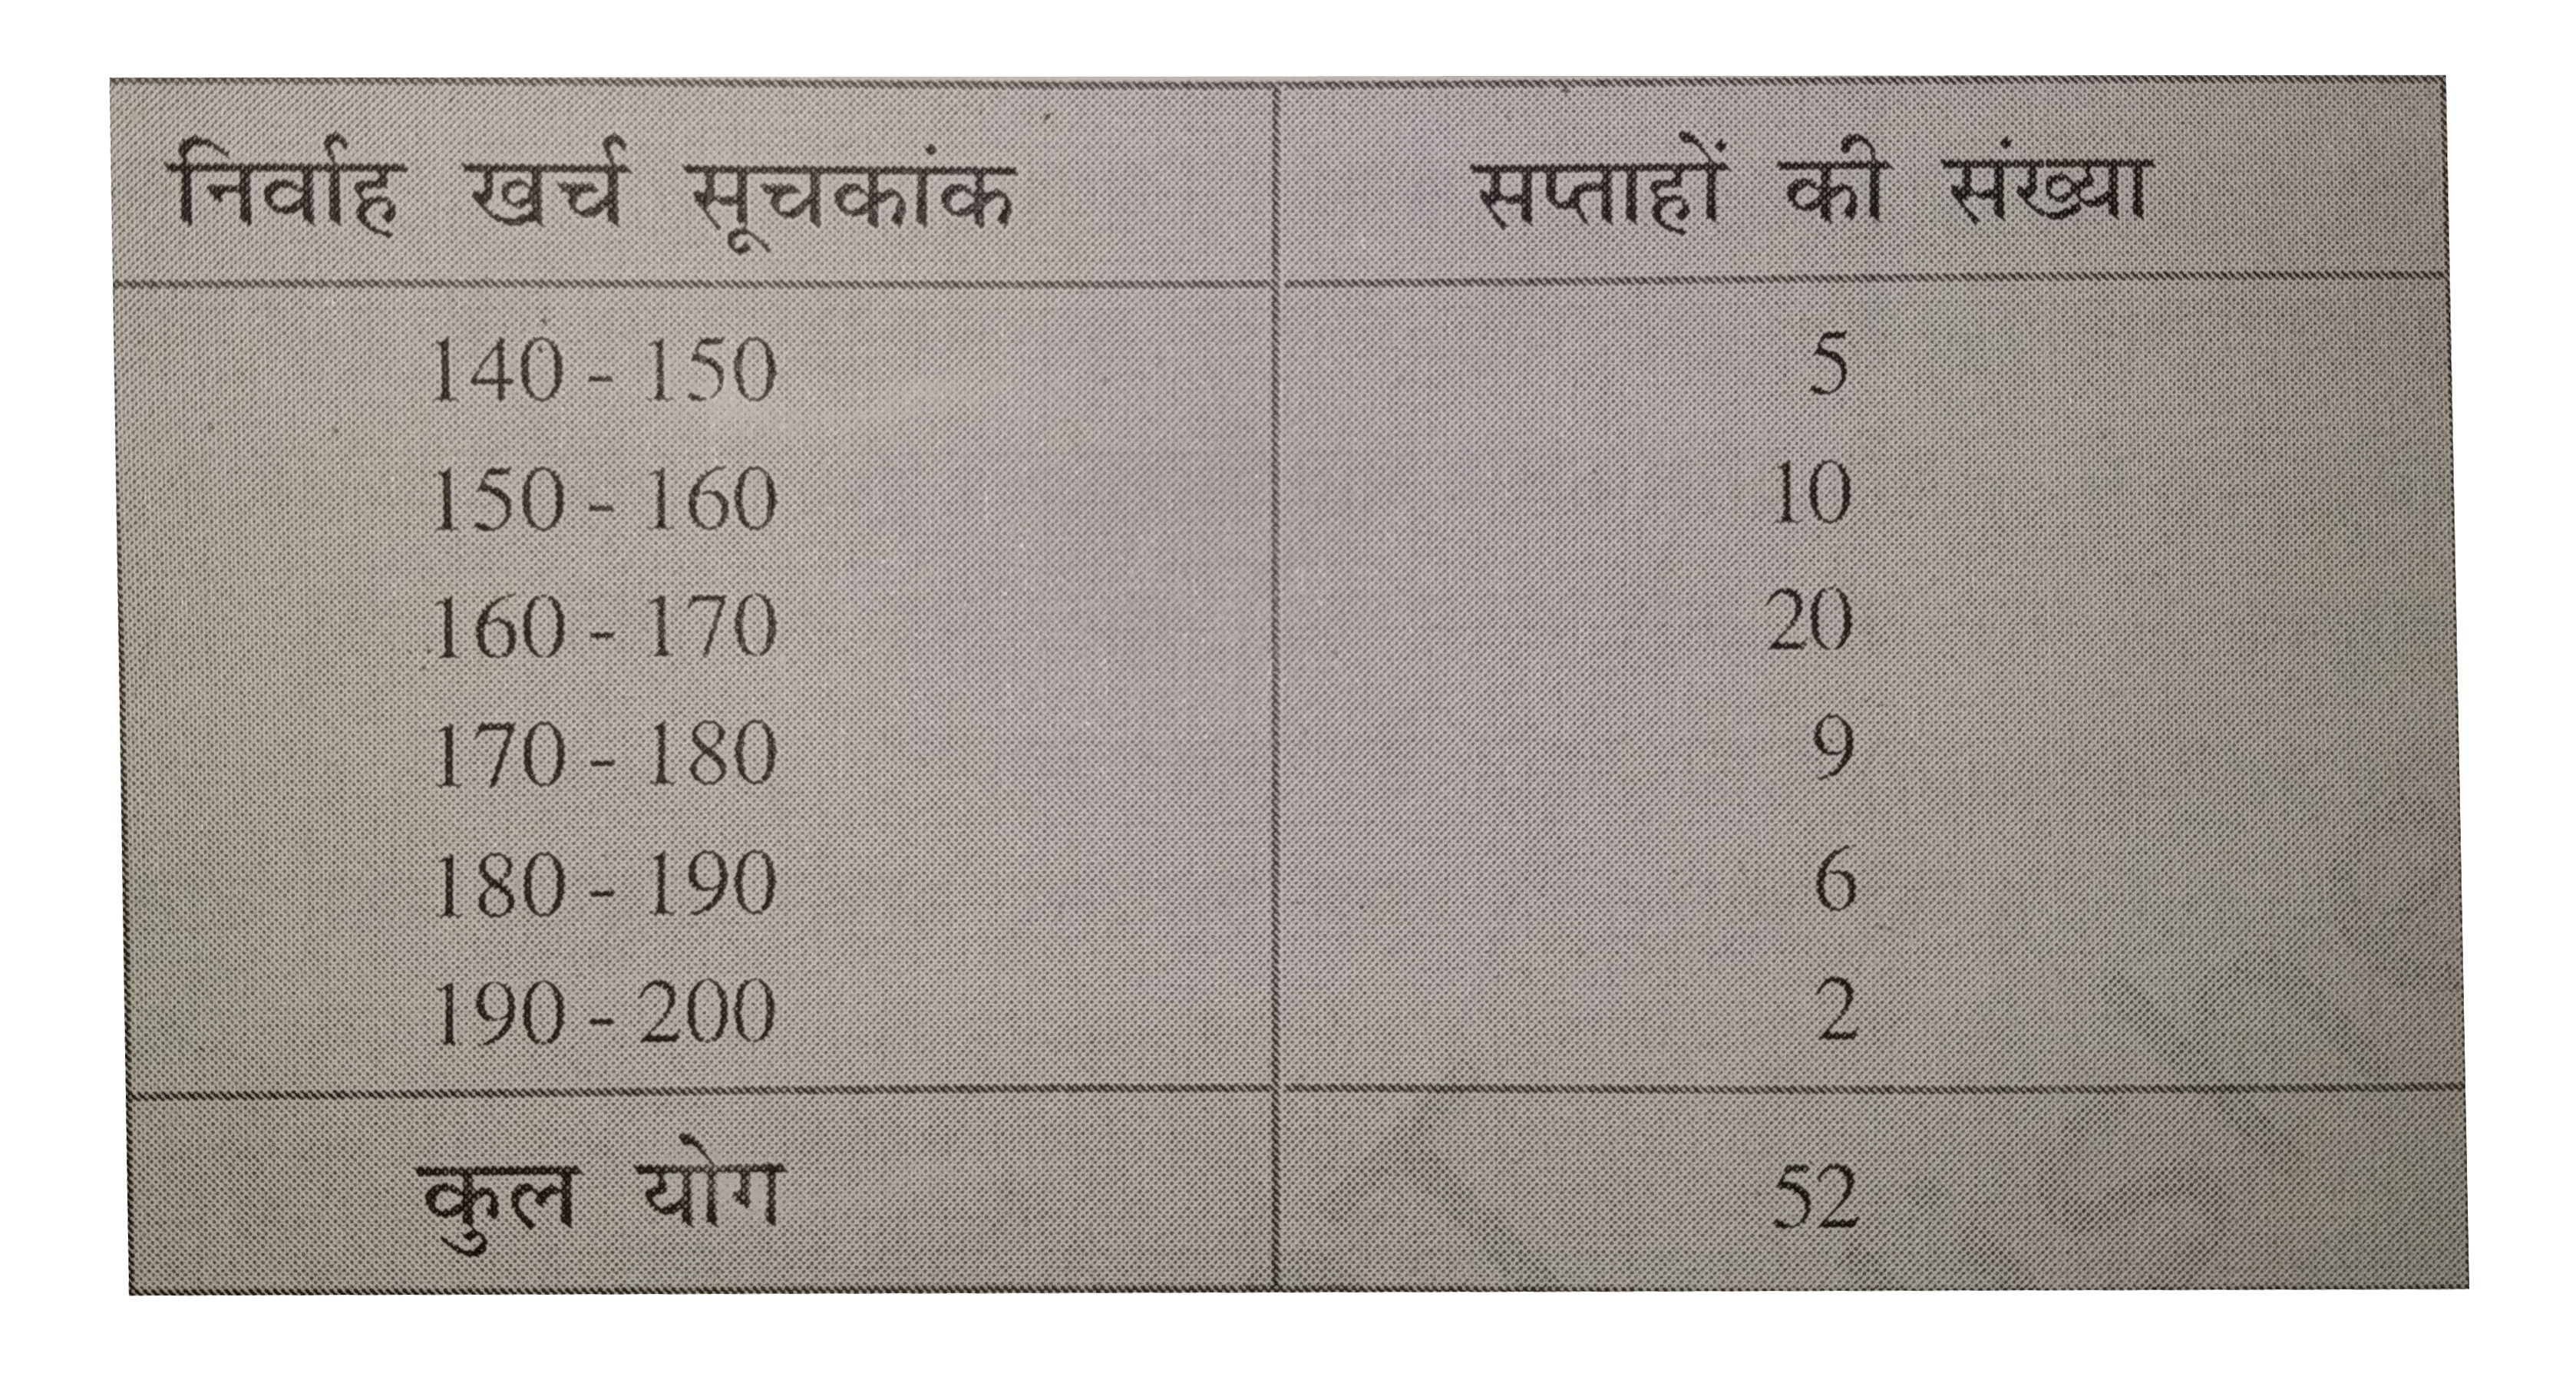
एक नगर में निर्वाह खर्च ( cost of living index) का अध्ययन करने निलिखित साप्ताहिक प्रेक्षण किए गए :

ऊपउ दिए गए आंकड़ों का एक बारंबारता बहुभुज ( आयातचित्र बनाए बिना ) खीचिए।
Step by step video & image solution for एक नगर में निर्वाह खर्च ( cost of living index) का अध्ययन करने निलिखित साप्ताहिक प्रेक्षण किए गए : ऊपउ दिए गए आंकड़ों का एक बारंबारता बहुभुज ( आयातचित्र बनाए बिना ) खीचिए। by Maths experts to help you in doubts & scoring excellent marks in Class 9 exams.
Topper's Solved these Questions
- BOOK - NCERT HINDICHAPTER - सांख्यिकीEXERCISE - प्रश्नावली 14.12videos
सांख्यिकी
- BOOK - NCERT HINDICHAPTER - सांख्यिकीEXERCISE - प्रश्नावली 14.29videos
सांख्यिकी
- BOOK - NCERT HINDICHAPTER - समांतर चतुर्भुजों और त्रिभुजों के क्षेत्रफल EXERCISE - प्रश्नावली 9.48videos
समांतर चतुर्भुजों और त्रिभुजों के क्षेत्रफल
- BOOK - NCERT HINDICHAPTER - हीरोन का सूत्र EXERCISE - प्रश्नावली 12.29videos
हीरोन का सूत्र
Similar Questions
उन आंकड़ों के पाँच उदाहरण दीजिए जिन्हे आप अपने दैनिक जीवन से एकत्रित कर सकते हैं।
01:37View Solutionआठवीं कक्षा के 30 विद्यार्थियों के रक्त समूह ये हैः
A,B,O,O,AB,O,A,O,B,A,O,B,A,O,OA,AB,O,A,A,O,O,AB,B,A,O,B,A,B,O
इन आंकड़ों को एक बारंबारता बंटन सारणी के रूप में प्रस्तुत कीजिए। बताइए की इन विद्यार्थियों में कौन-सा रक्त समूह अधिक सामान्य है और कौन-सा रक्त समूह विरलतम रक्त समूह है।06:07View Solutionसमांतर चतुर्भुज ABCD और आयत ABEF एक ही आधार पर स्थित है और उनके क्षेत्रफल बराबर है । दर्शाइए की समांतर चतुर्भुज का परिमाप आयत के परिमाप से अधिक है ।
02:11View Solutionएक पार्क चतुर्भुज ABCD के आकार का है, जिसमे ∠C=90∘,AB=9 मी, BC=12 मी, CD=5 मी और AD=8 मी है। इस पार्क का कितना क्षेत्रफल है?
01:31View SolutionHow many lines of symmetry does the above figure have ?
02:45View SolutionWhich of the following are correct chain isomers of butane ? (i)
02:17View SolutionDetermine the point of symmetry of a regular hexagon.
05:41View SolutionDtermine the images of the following figure about the given line :
02:21View SolutionMatch the following Column A to Column B
 02:03View Solution
Match the following Column A to Column B
 02:10View Solution
Match the following Column A to Column B
 02:17View Solution
Find the area of the figure given below.
 02:10View Solution
The area of the shaded part in the figure given below is ______.
 04:23View Solution
The inequation represented by the graph given below is :
01:13View SolutionThe inequation that best describes the graph given below is _________
03:12View SolutionThe inequation that best describes the following graph is _________
05:46View Solution

