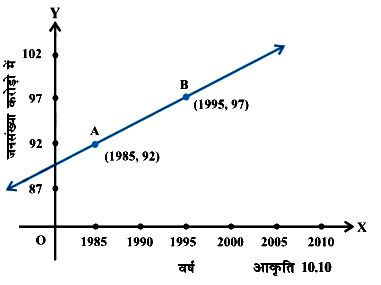
जनसंख्या और वर्ष के निम्नलिखित लेखाचित्र पर विचार कीजिए रेखा AB कि ढाल ज्ञात कीजिए और इसके प्रयोग से बताइए कि वर्ष 2010 में जनसंख्या कितनी होगी ?

The correct Answer is:12,104.5 करोड़
Step by step video & image solution for जनसंख्या और वर्ष के निम्नलिखित लेखाचित्र पर विचार कीजिए रेखा AB कि ढाल ज्ञात कीजिए और इसके प्रयोग से बताइए कि वर्ष 2010 में जनसंख्या कितनी होगी ? by Maths experts to help you in doubts & scoring excellent marks in Class 11 exams.
Updated on:21/07/2023Topper's Solved these Questions
- सरल रेखाएँBOOK - NCERT HINDICHAPTER - सरल रेखाएँEXERCISE - प्रश्नावली 10.2
20 Videos
- सरल रेखाएँBOOK - NCERT HINDICHAPTER - सरल रेखाएँEXERCISE - प्रश्नावली 10.3
18 Videos
- सरल रेखाएँBOOK - NCERT HINDICHAPTER - सरल रेखाएँEXERCISE - विविध प्रश्नावली
26 Videos
- सम्मुच्चयBOOK - NCERT HINDICHAPTER - सम्मुच्चयEXERCISE - अध्याय 1 पर विविध प्रश्नावली
16 Videos
- सांखियकी BOOK - NCERT HINDICHAPTER - सांखियकी EXERCISE - अध्याय 15 पर विविध प्रश्नावली
7 Videos
Similar Questions
x और y -अक्षों के समीकरण लिखिए।
View Solutionनिम्नलिखित समीकरणों को ढाल-अन्तःखंड रुप में रूपांतरित कीजिए और उनके ढाल तथा y -अन्तःखंड ज्ञात कीजिए :
(i)x+7y=0 (ii)6x+3y−5=0 (iii)y=0
View Solutionk के मान ज्ञात कीजिए जबकि रेखा (k−3)x−(4−k2)y+k2−7k+6=0
x -अक्ष के समांतर है ।
View Solutionनिम्नलिखित समुच्चयों में से किसका उपसमुच्चय है, इसका निर्णय कीजिए!
A{x:x ∈ R तथा x2−8x+12=0 को संतुस्ट करने वाली सभी वास्तविक संख्यायें x },B={2,4,6},C={2,4,6,8,.....},D={6}.
View Solutionआठ प्रेक्षणों का माध्य तथा प्रसरण क्रमशः 9 और 9.25 है। यदि इनमें से छः प्रेक्षण 67,10,12,12,13 है तो शेष दो प्रेक्षण ज्ञात कीजिए।
View SolutionHow many lines of symmetry does the above figure have ?
View SolutionWhich of the following are correct chain isomers of butane ? (i)
View SolutionDetermine the point of symmetry of a regular hexagon.
View SolutionDtermine the images of the following figure about the given line :
View SolutionMatch the following Column A to Column B

View SolutionMatch the following Column A to Column B

View SolutionMatch the following Column A to Column B

View SolutionFind the area of the figure given below.

View SolutionThe area of the shaded part in the figure given below is ______.

View SolutionThe inequation represented by the graph given below is :
View SolutionThe inequation that best describes the graph given below is _________
View Solution