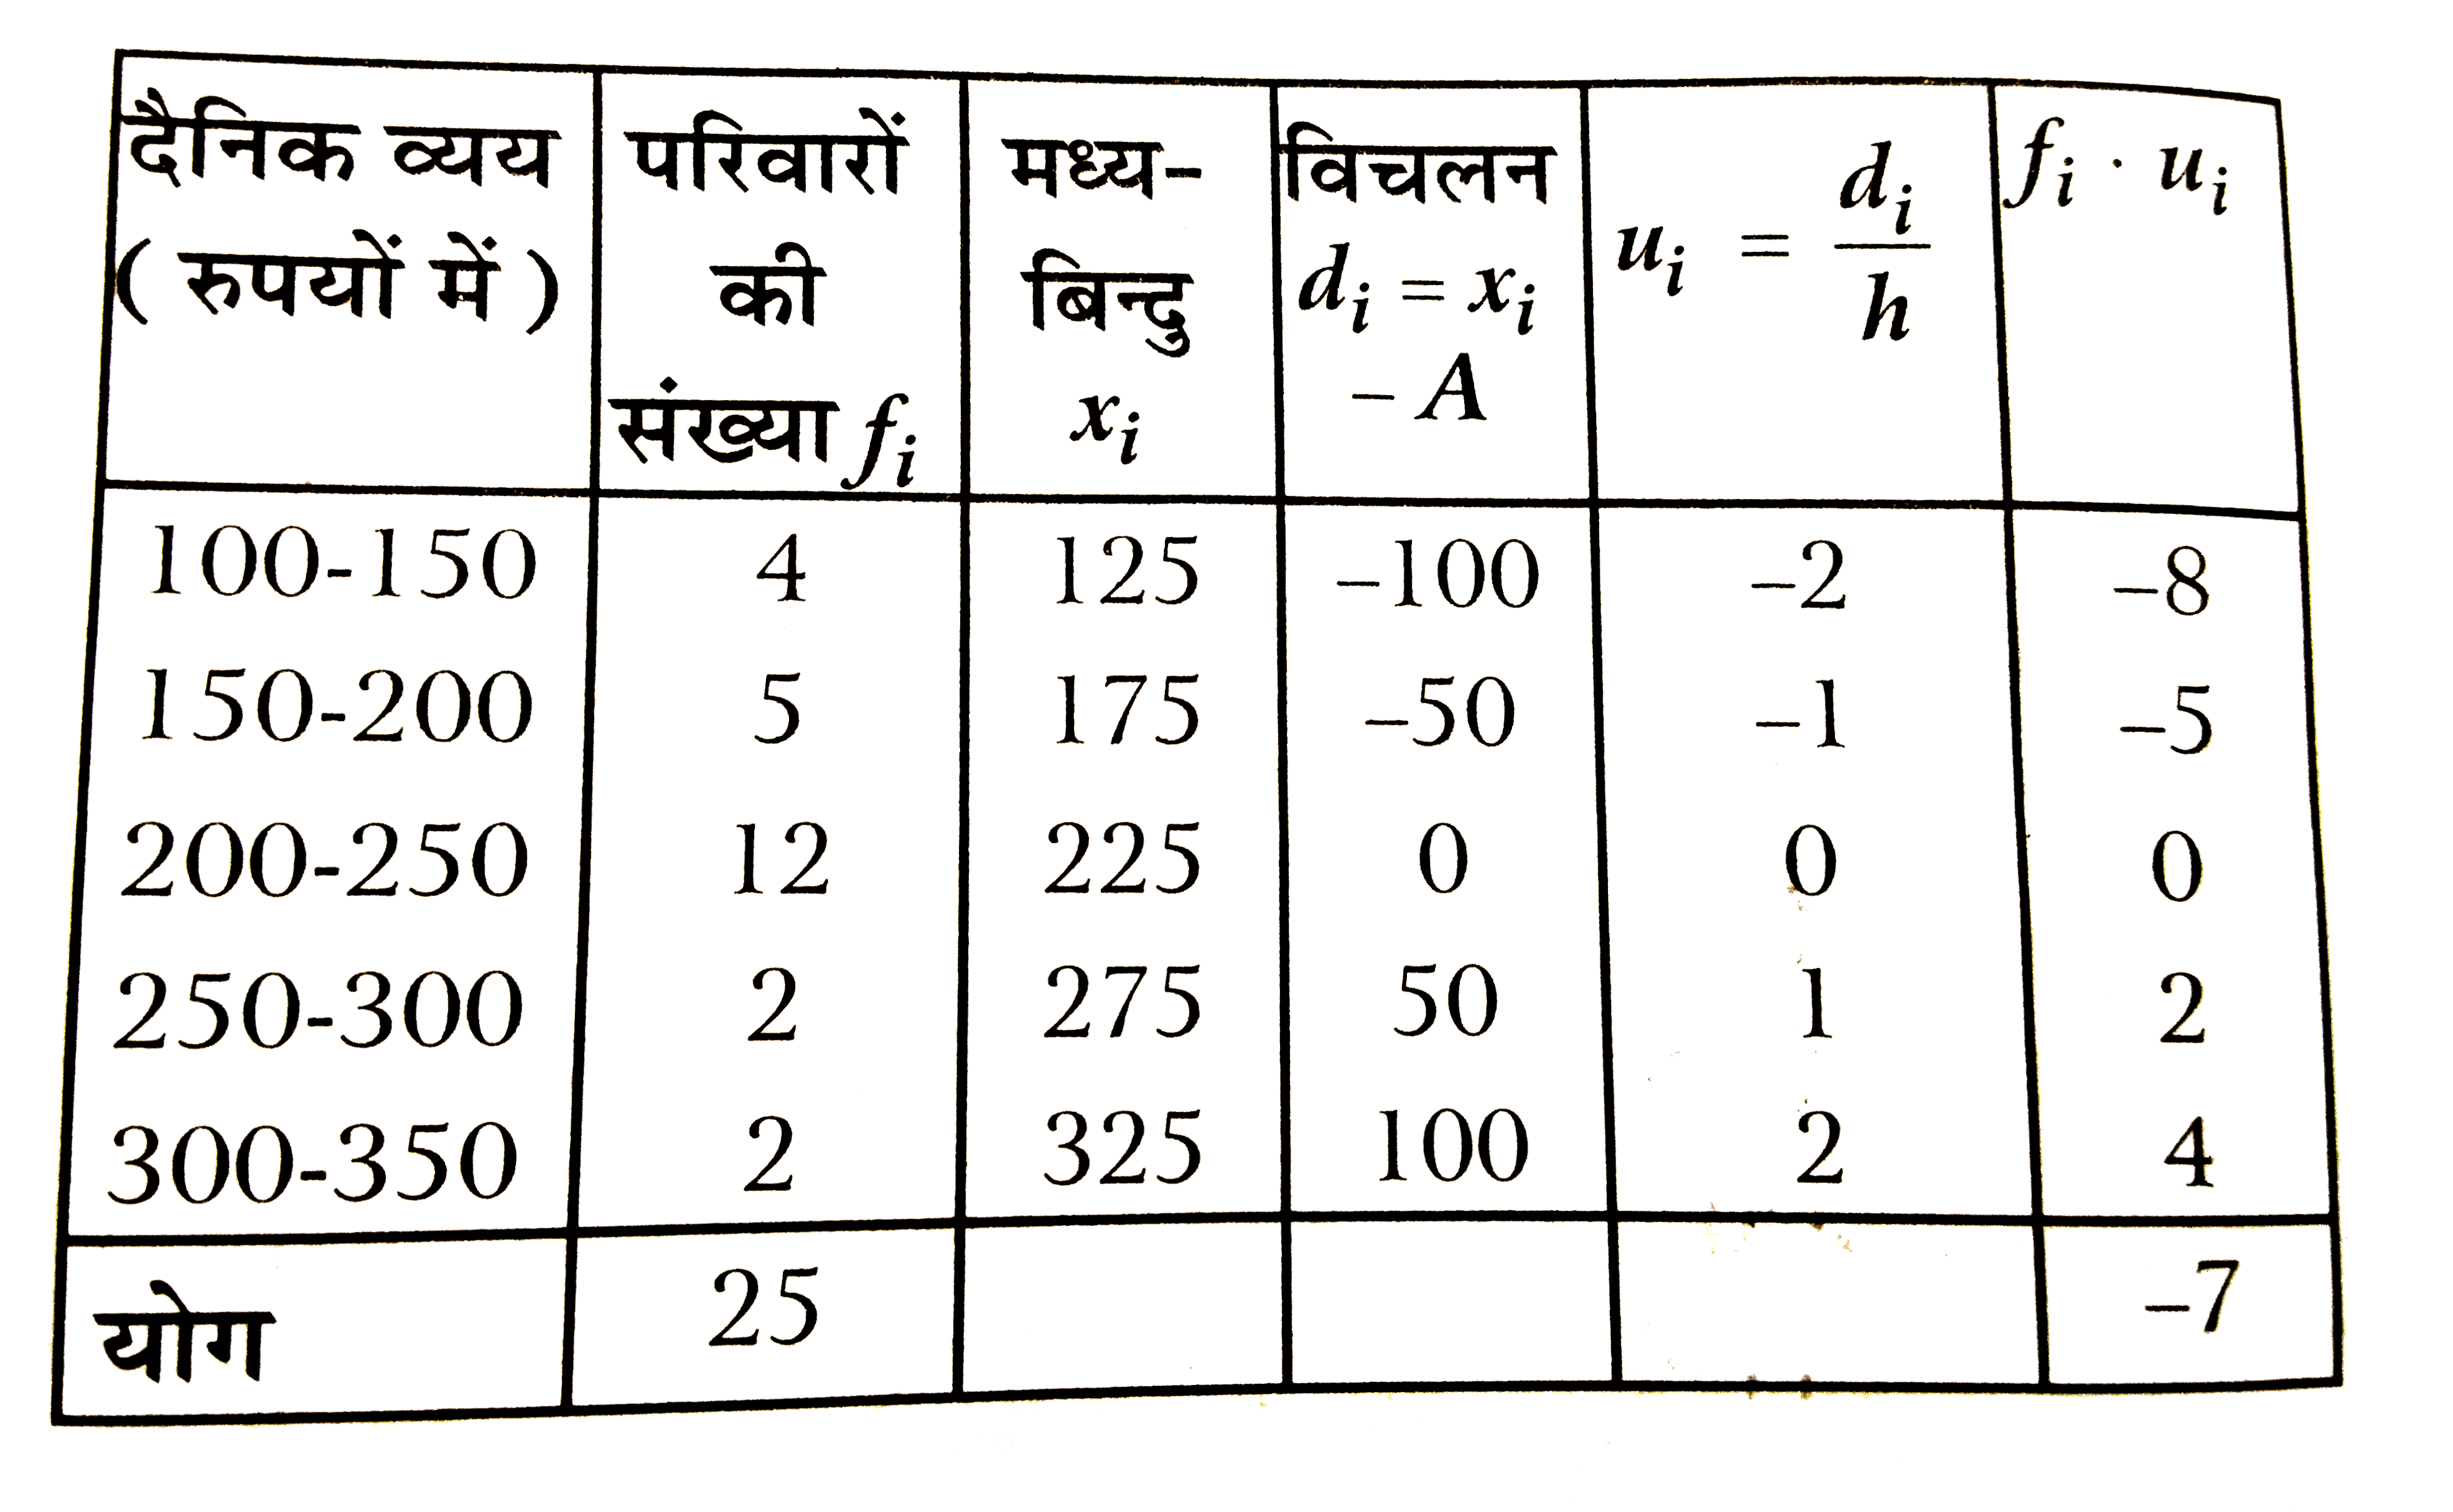
निम्नलिखित सारणी किसी मोहल्ले के 25 परिवारों में भोजन पर हुए दैनिक व्यय को दर्शाती है

एक उपयुक्त विधि द्वारा भोजन पर हुआ माध्य व्यय ज्ञात कीजिये
यहाँ h = 50
माना कल्पित माध्य A = र 225

∴ माध्य ¯x=A+h⋅Σfi⋅μiΣfi=225+50×(−7)25
=225−14=211
अतः प्रति परिवार भोजन पर होने वाले दैनिक व्यय का माध्य = ₹ 211
Topper's Solved these Questions
- BOOK - NOOTAN HINDICHAPTER - सांख्यिकीEXERCISE - प्रश्नावली 14.26videos
सांख्यिकी
- BOOK - NOOTAN HINDICHAPTER - सांख्यिकीEXERCISE - प्रश्नावली 14.37videos
सांख्यिकी
- BOOK - NOOTAN HINDICHAPTER - सांख्यिकीEXERCISE - प्रश्नावली 14 E3videos
सांख्यिकी
- BOOK - NOOTAN HINDICHAPTER - समान्तर श्रेढ़ी EXERCISE - विविध प्रश्नावली ( बहुविकल्पीय प्रश्न )7videos
समान्तर श्रेढ़ी
Similar Questions
निम्नलिखित सारणी किसी अस्पताल में एक विशेष में भर्ती हुए रोगियों की आयु को दर्शाती है:

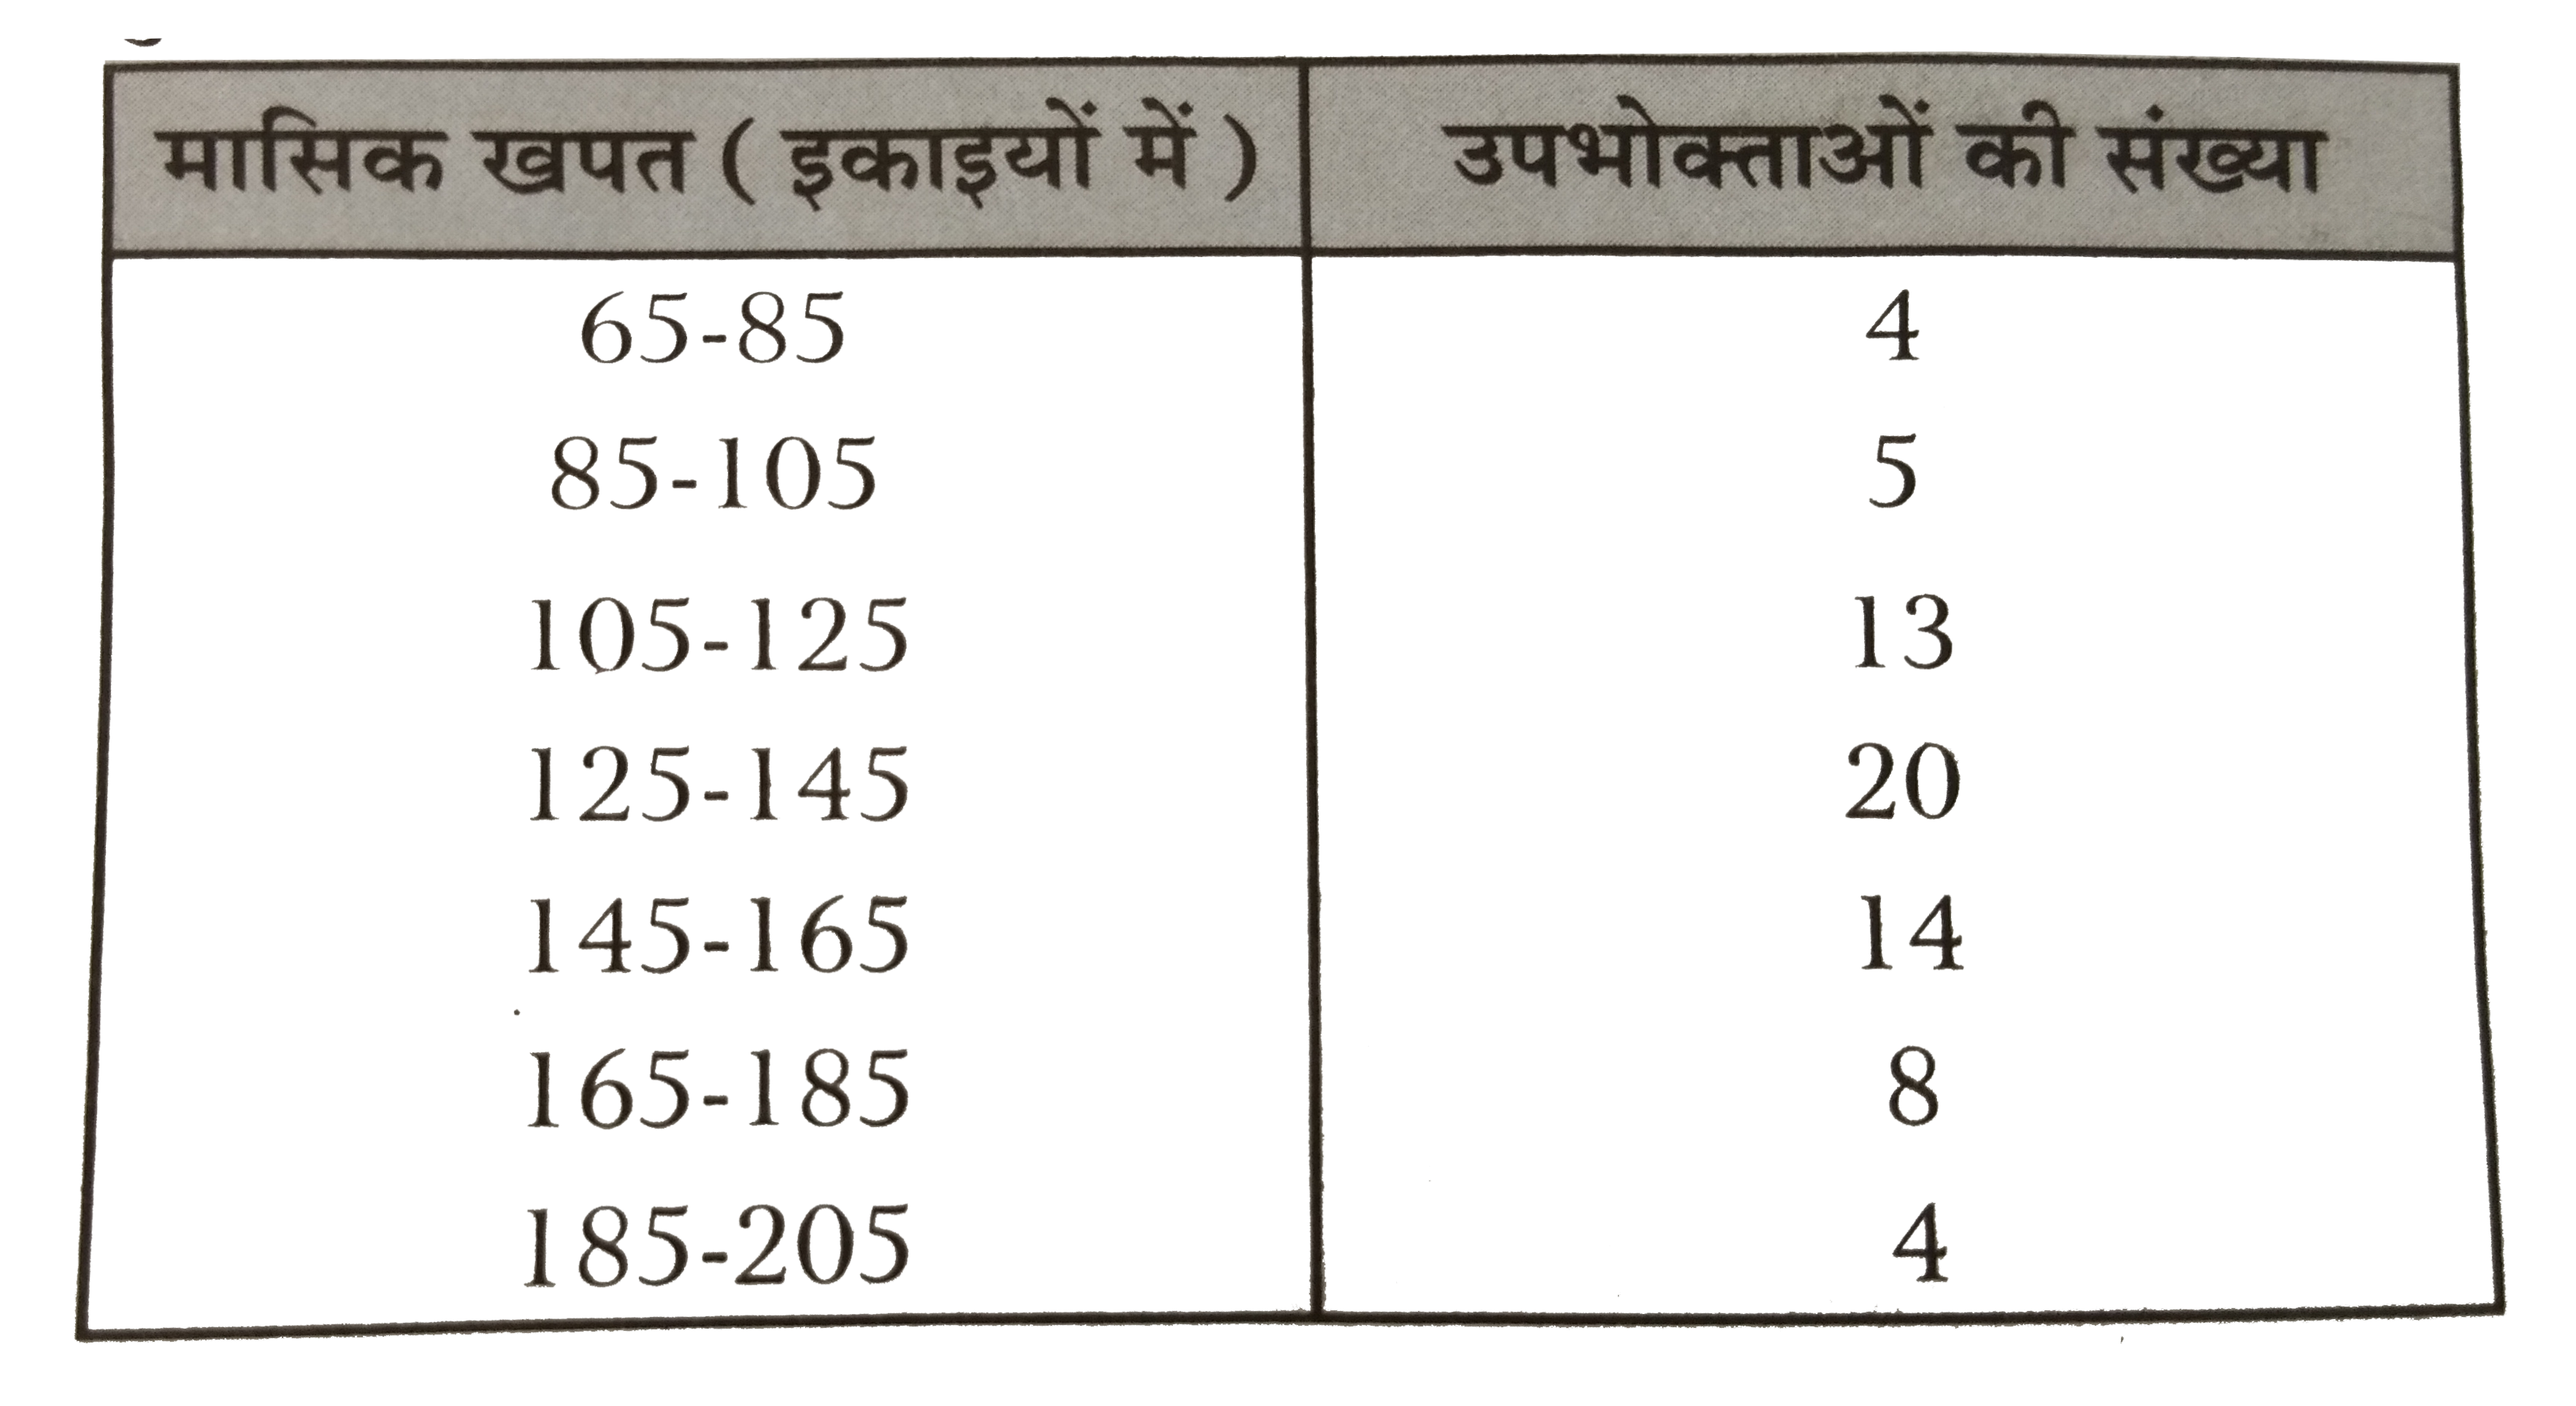
उपरोक्त आंकड़ों के बहुलक और माध्य ज्ञात कीजिये दोनों केंद्रीय प्रवती की मापो की तुलना कीजिये और उनकी व्याख्या कीजिये01:37View Solutionनिम्नलिखित बारम्बारता बंटन किसी मोहल्ले के 68 उपभोक्ताओं की बिजली की मासिक खपत दर्शाता है इन आंकड़ों के मध्यक, माध्य और बहुलक ज्ञात कीजिये इनकी तुलना कीजिये
 06:07View Solution
निम्नलिखित सरणी में एक समूह के फैक्टरी के मजदूरों की उचाईयों का वितरण दिया गया है :

इन आकड़ों से से अधिक श्रेणी के संचयी बारम्बारता वक्र बनाइए |02:11View Solution3 के प्रथम 6 गुणांकों का योग है:
01:31View SolutionHow many lines of symmetry does the above figure have ?
02:45View SolutionWhich of the following are correct chain isomers of butane ? (i)
02:17View SolutionDetermine the point of symmetry of a regular hexagon.
05:41View SolutionDtermine the images of the following figure about the given line :
02:21View SolutionMatch the following Column A to Column B
 02:03View Solution
Match the following Column A to Column B
 02:10View Solution
Match the following Column A to Column B
 02:17View Solution
Find the area of the figure given below.
 02:10View Solution
The area of the shaded part in the figure given below is ______.
 04:23View Solution
The inequation represented by the graph given below is :
01:13View SolutionThe inequation that best describes the graph given below is _________
03:12View SolutionThe inequation that best describes the following graph is _________
05:46View Solution

