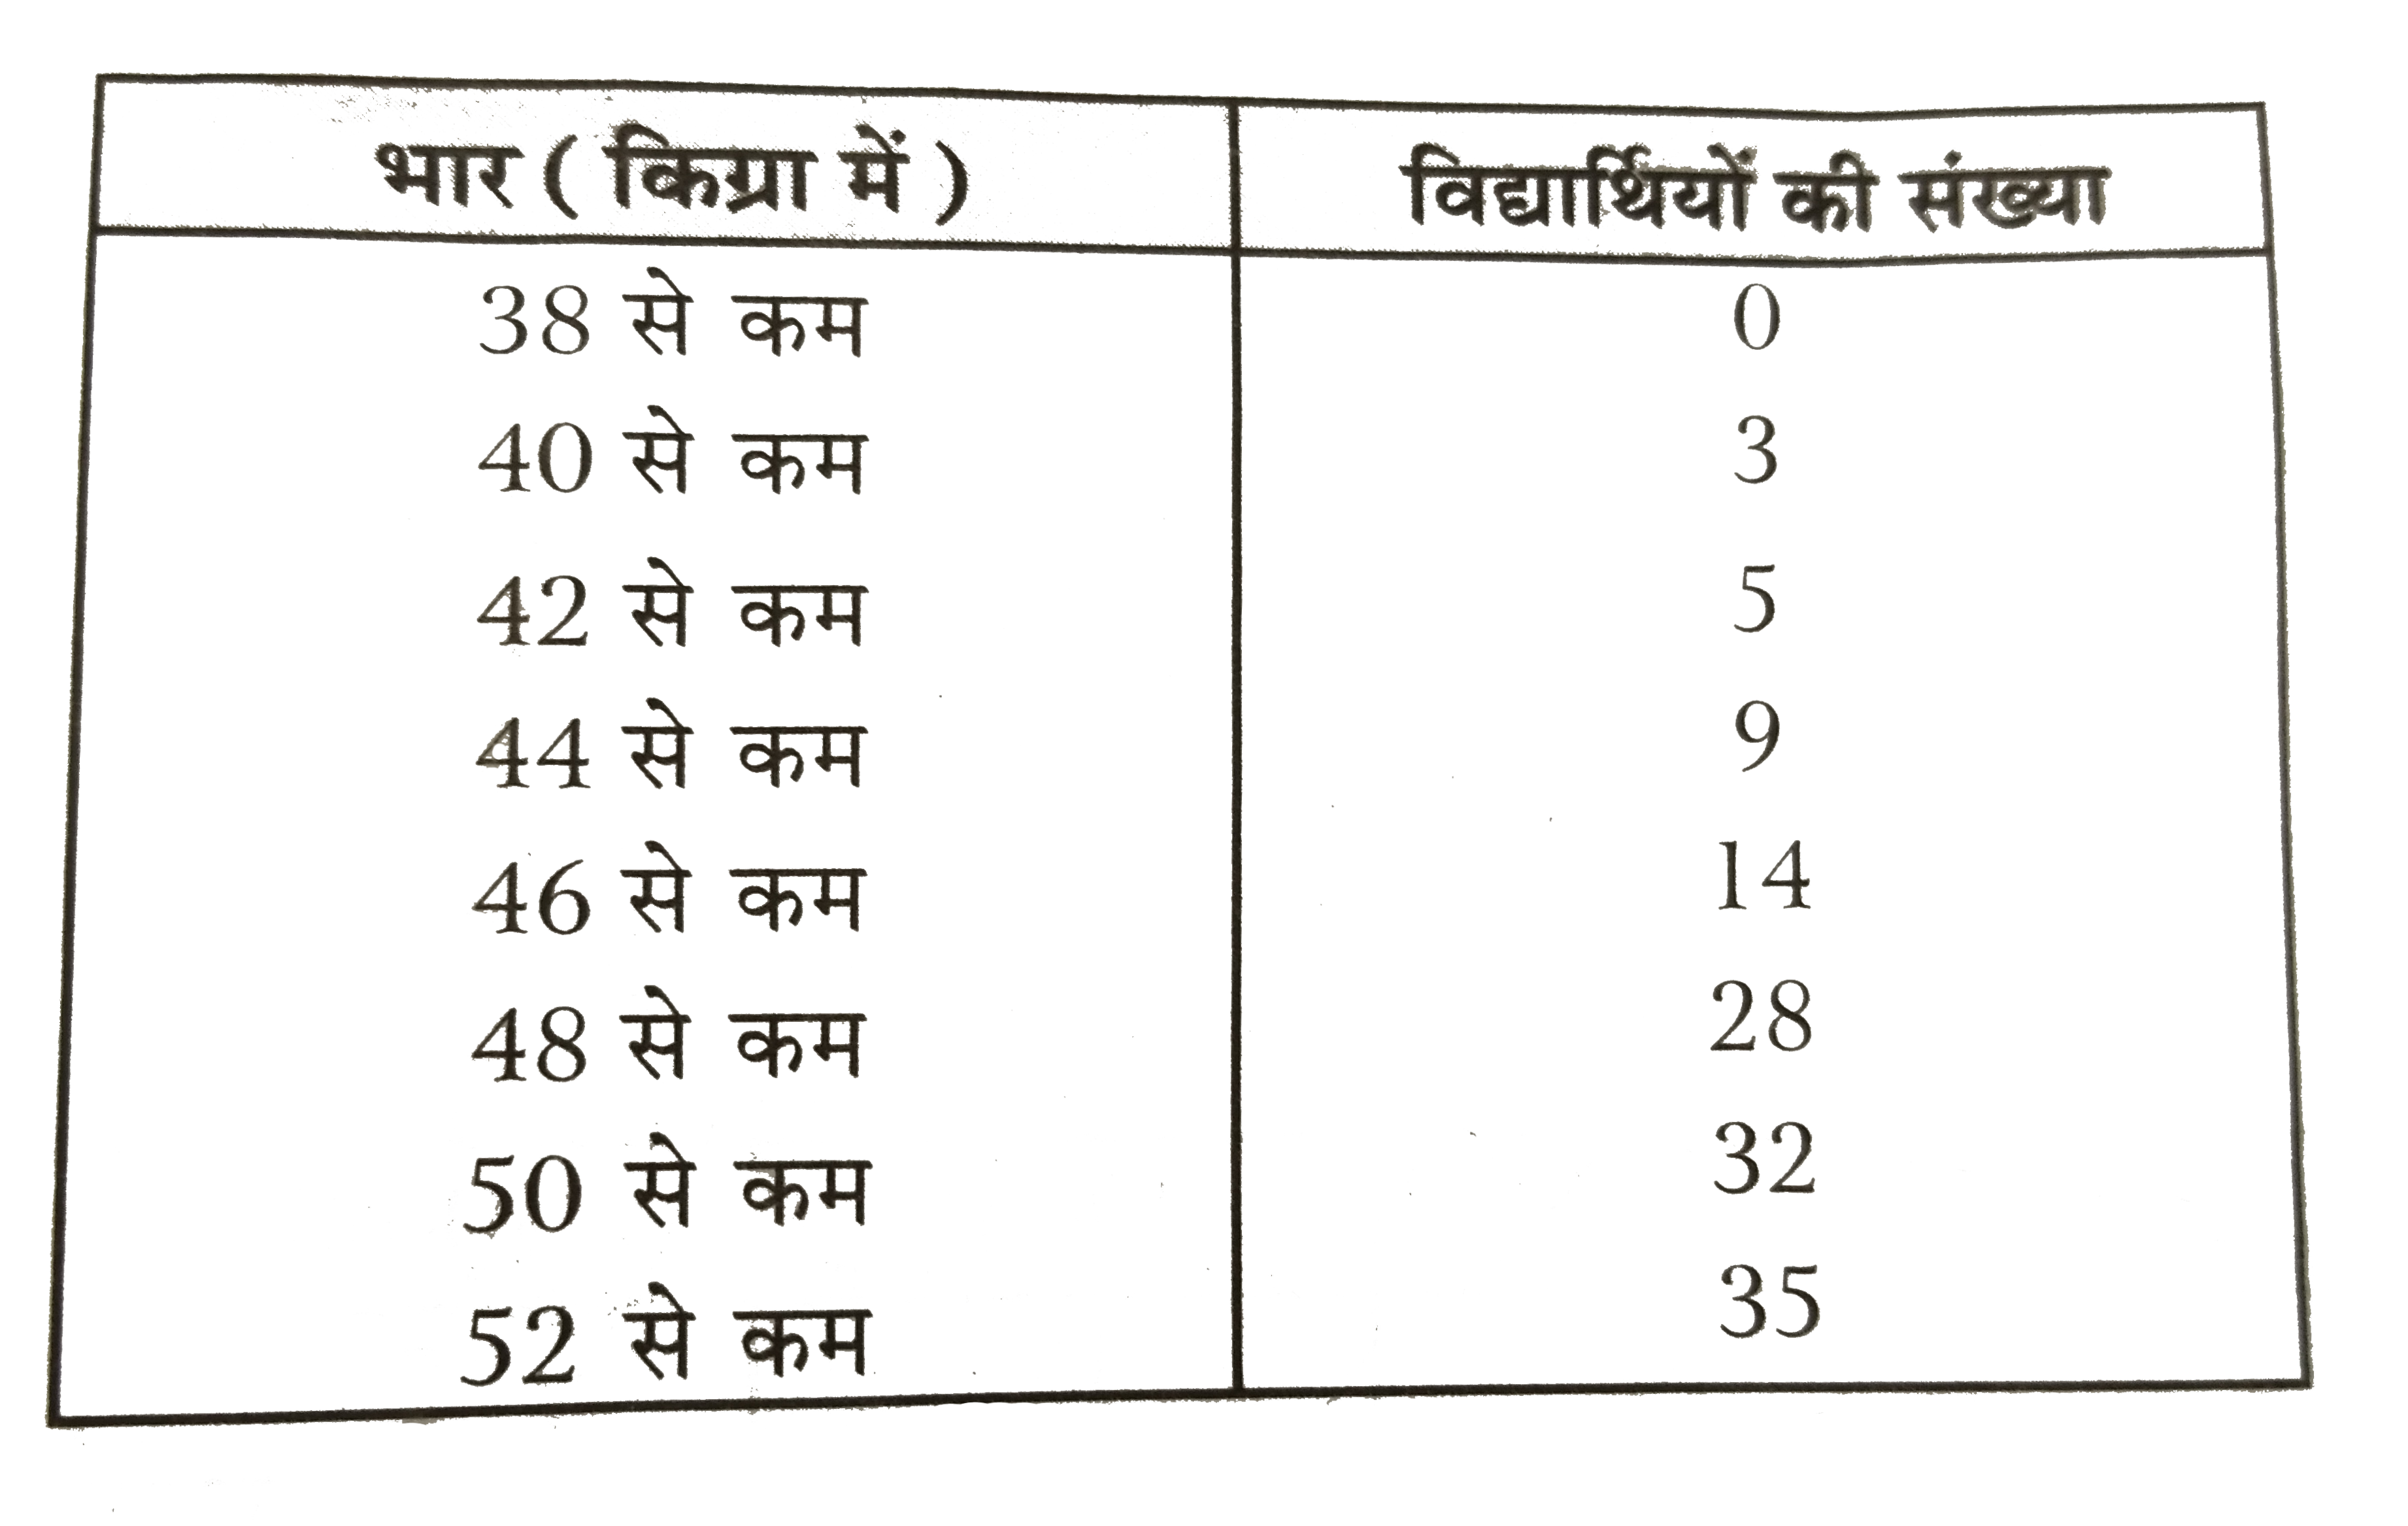
किसी कक्षा के 35 विद्यार्थियों की मेडिकल जांच समय उनके भार निम्नलिखित रूप में रिकॉर्ड किये गए:

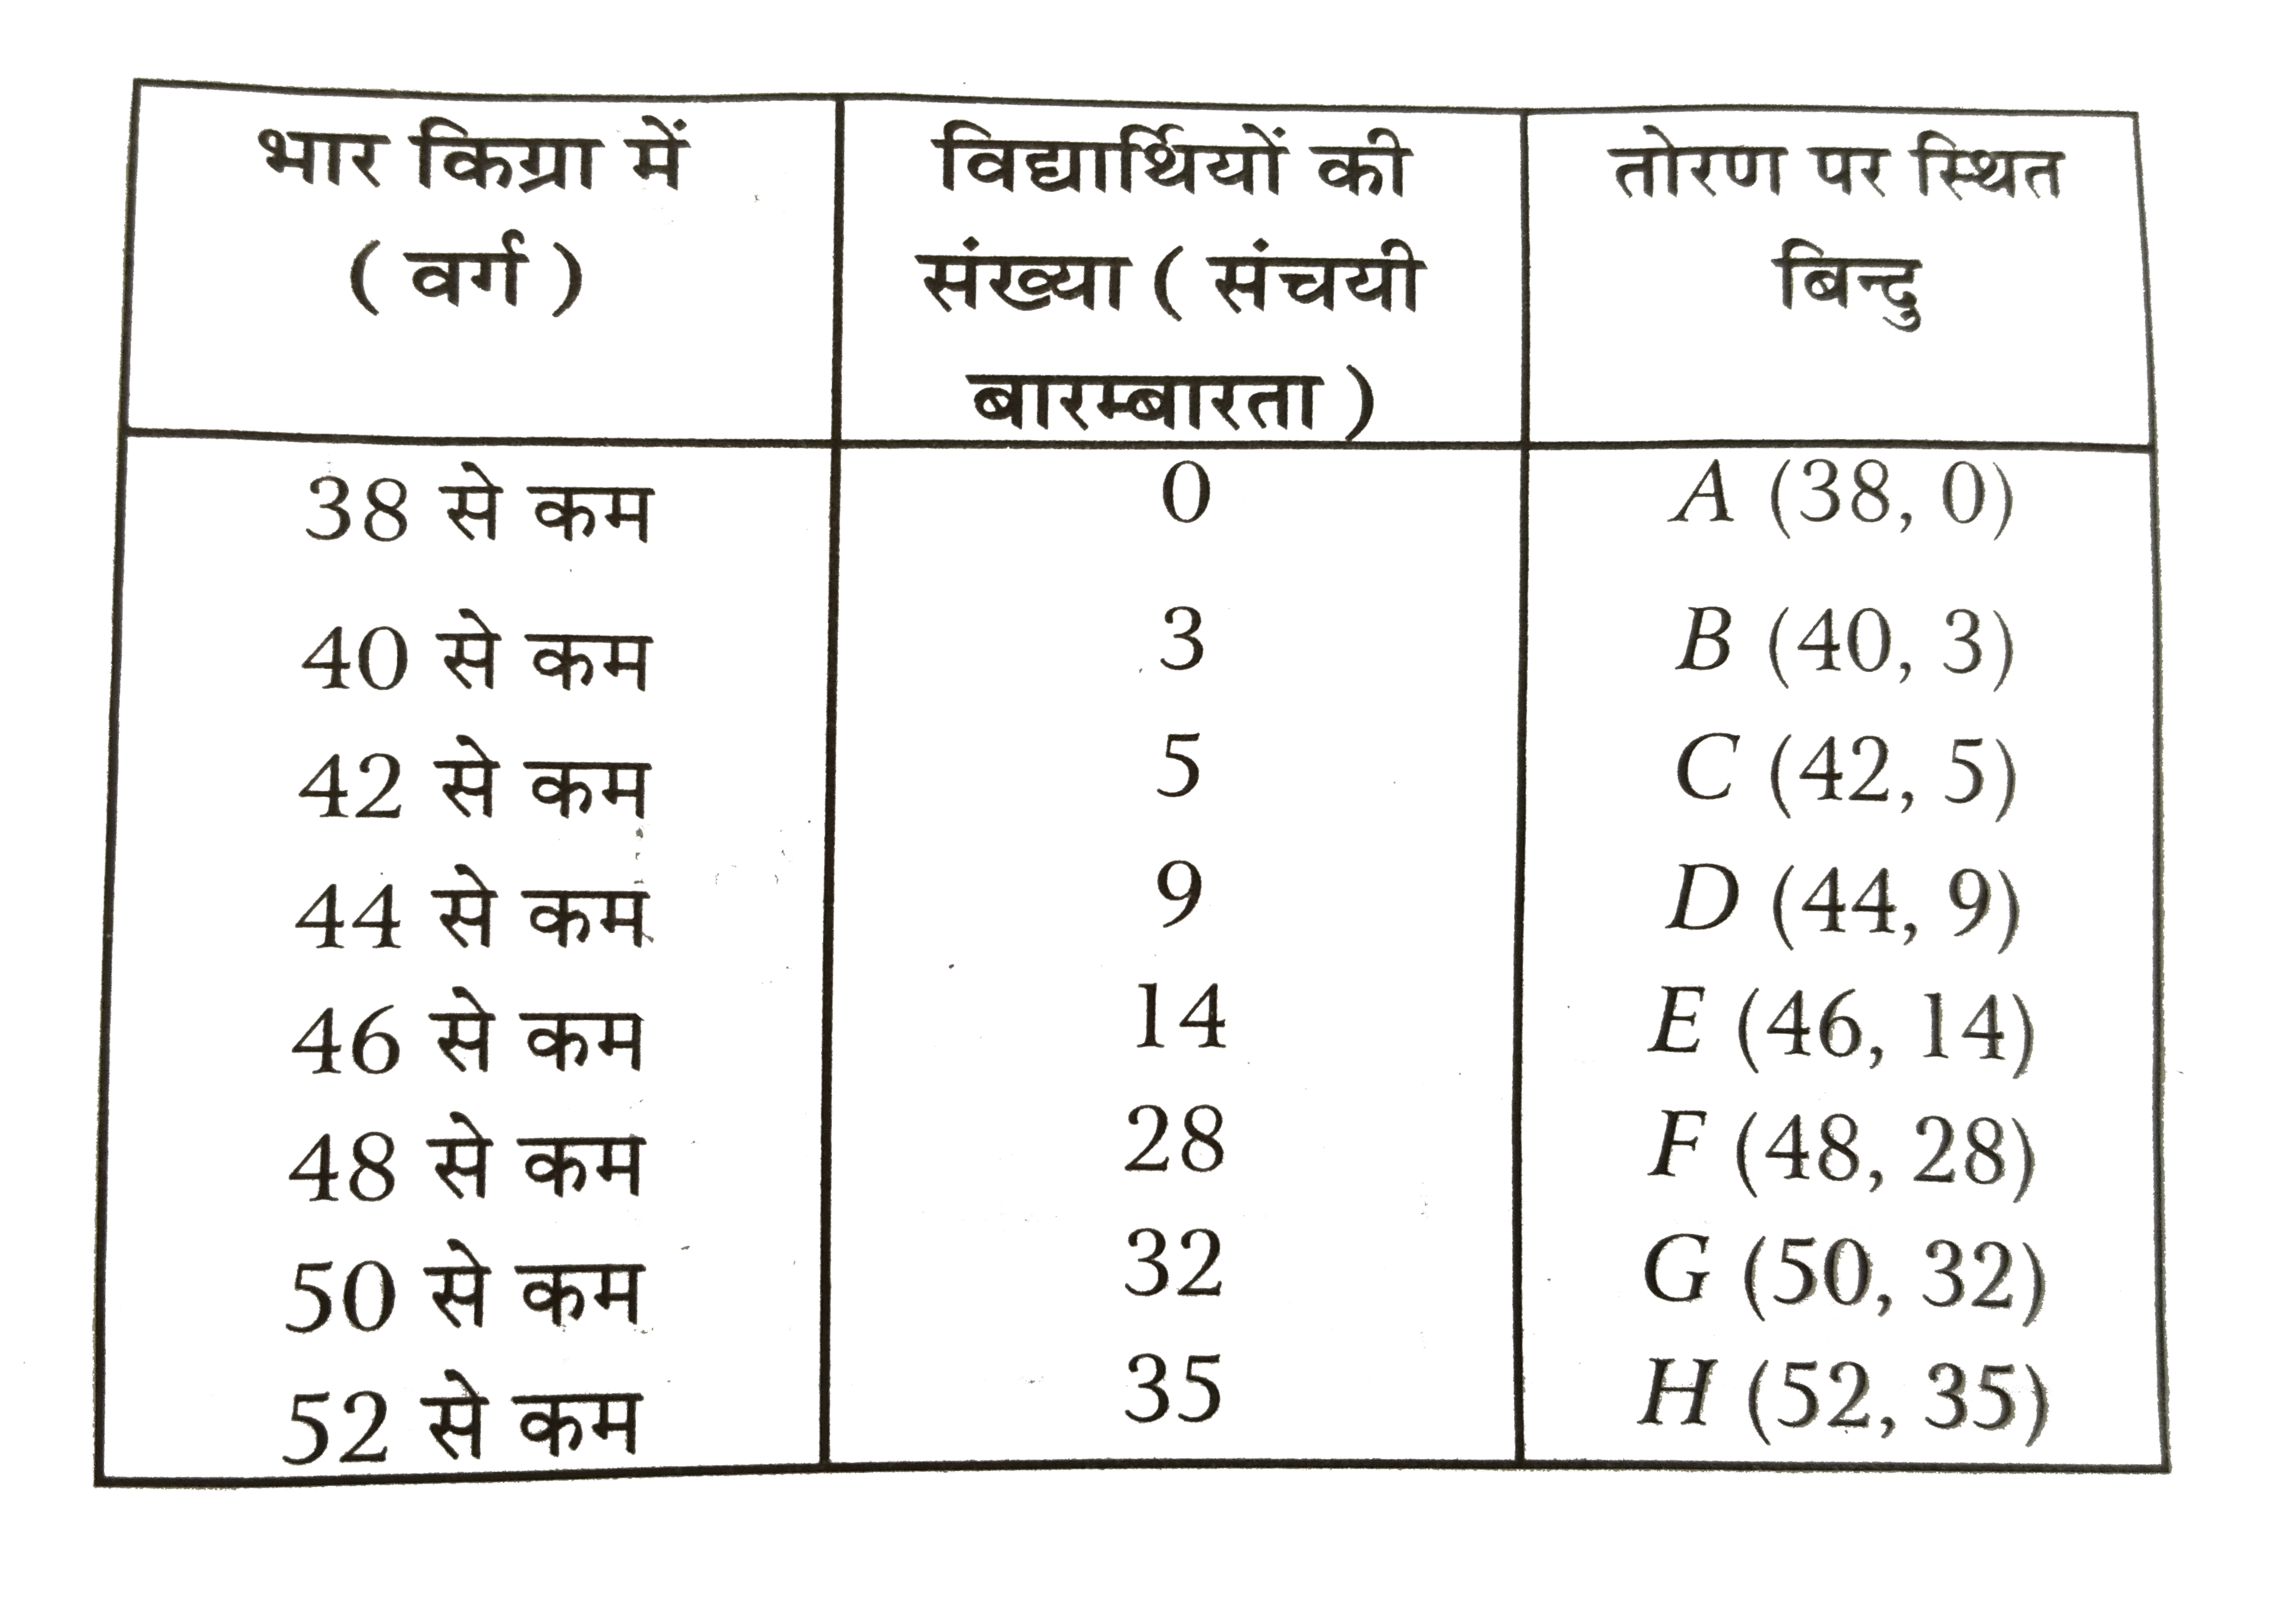
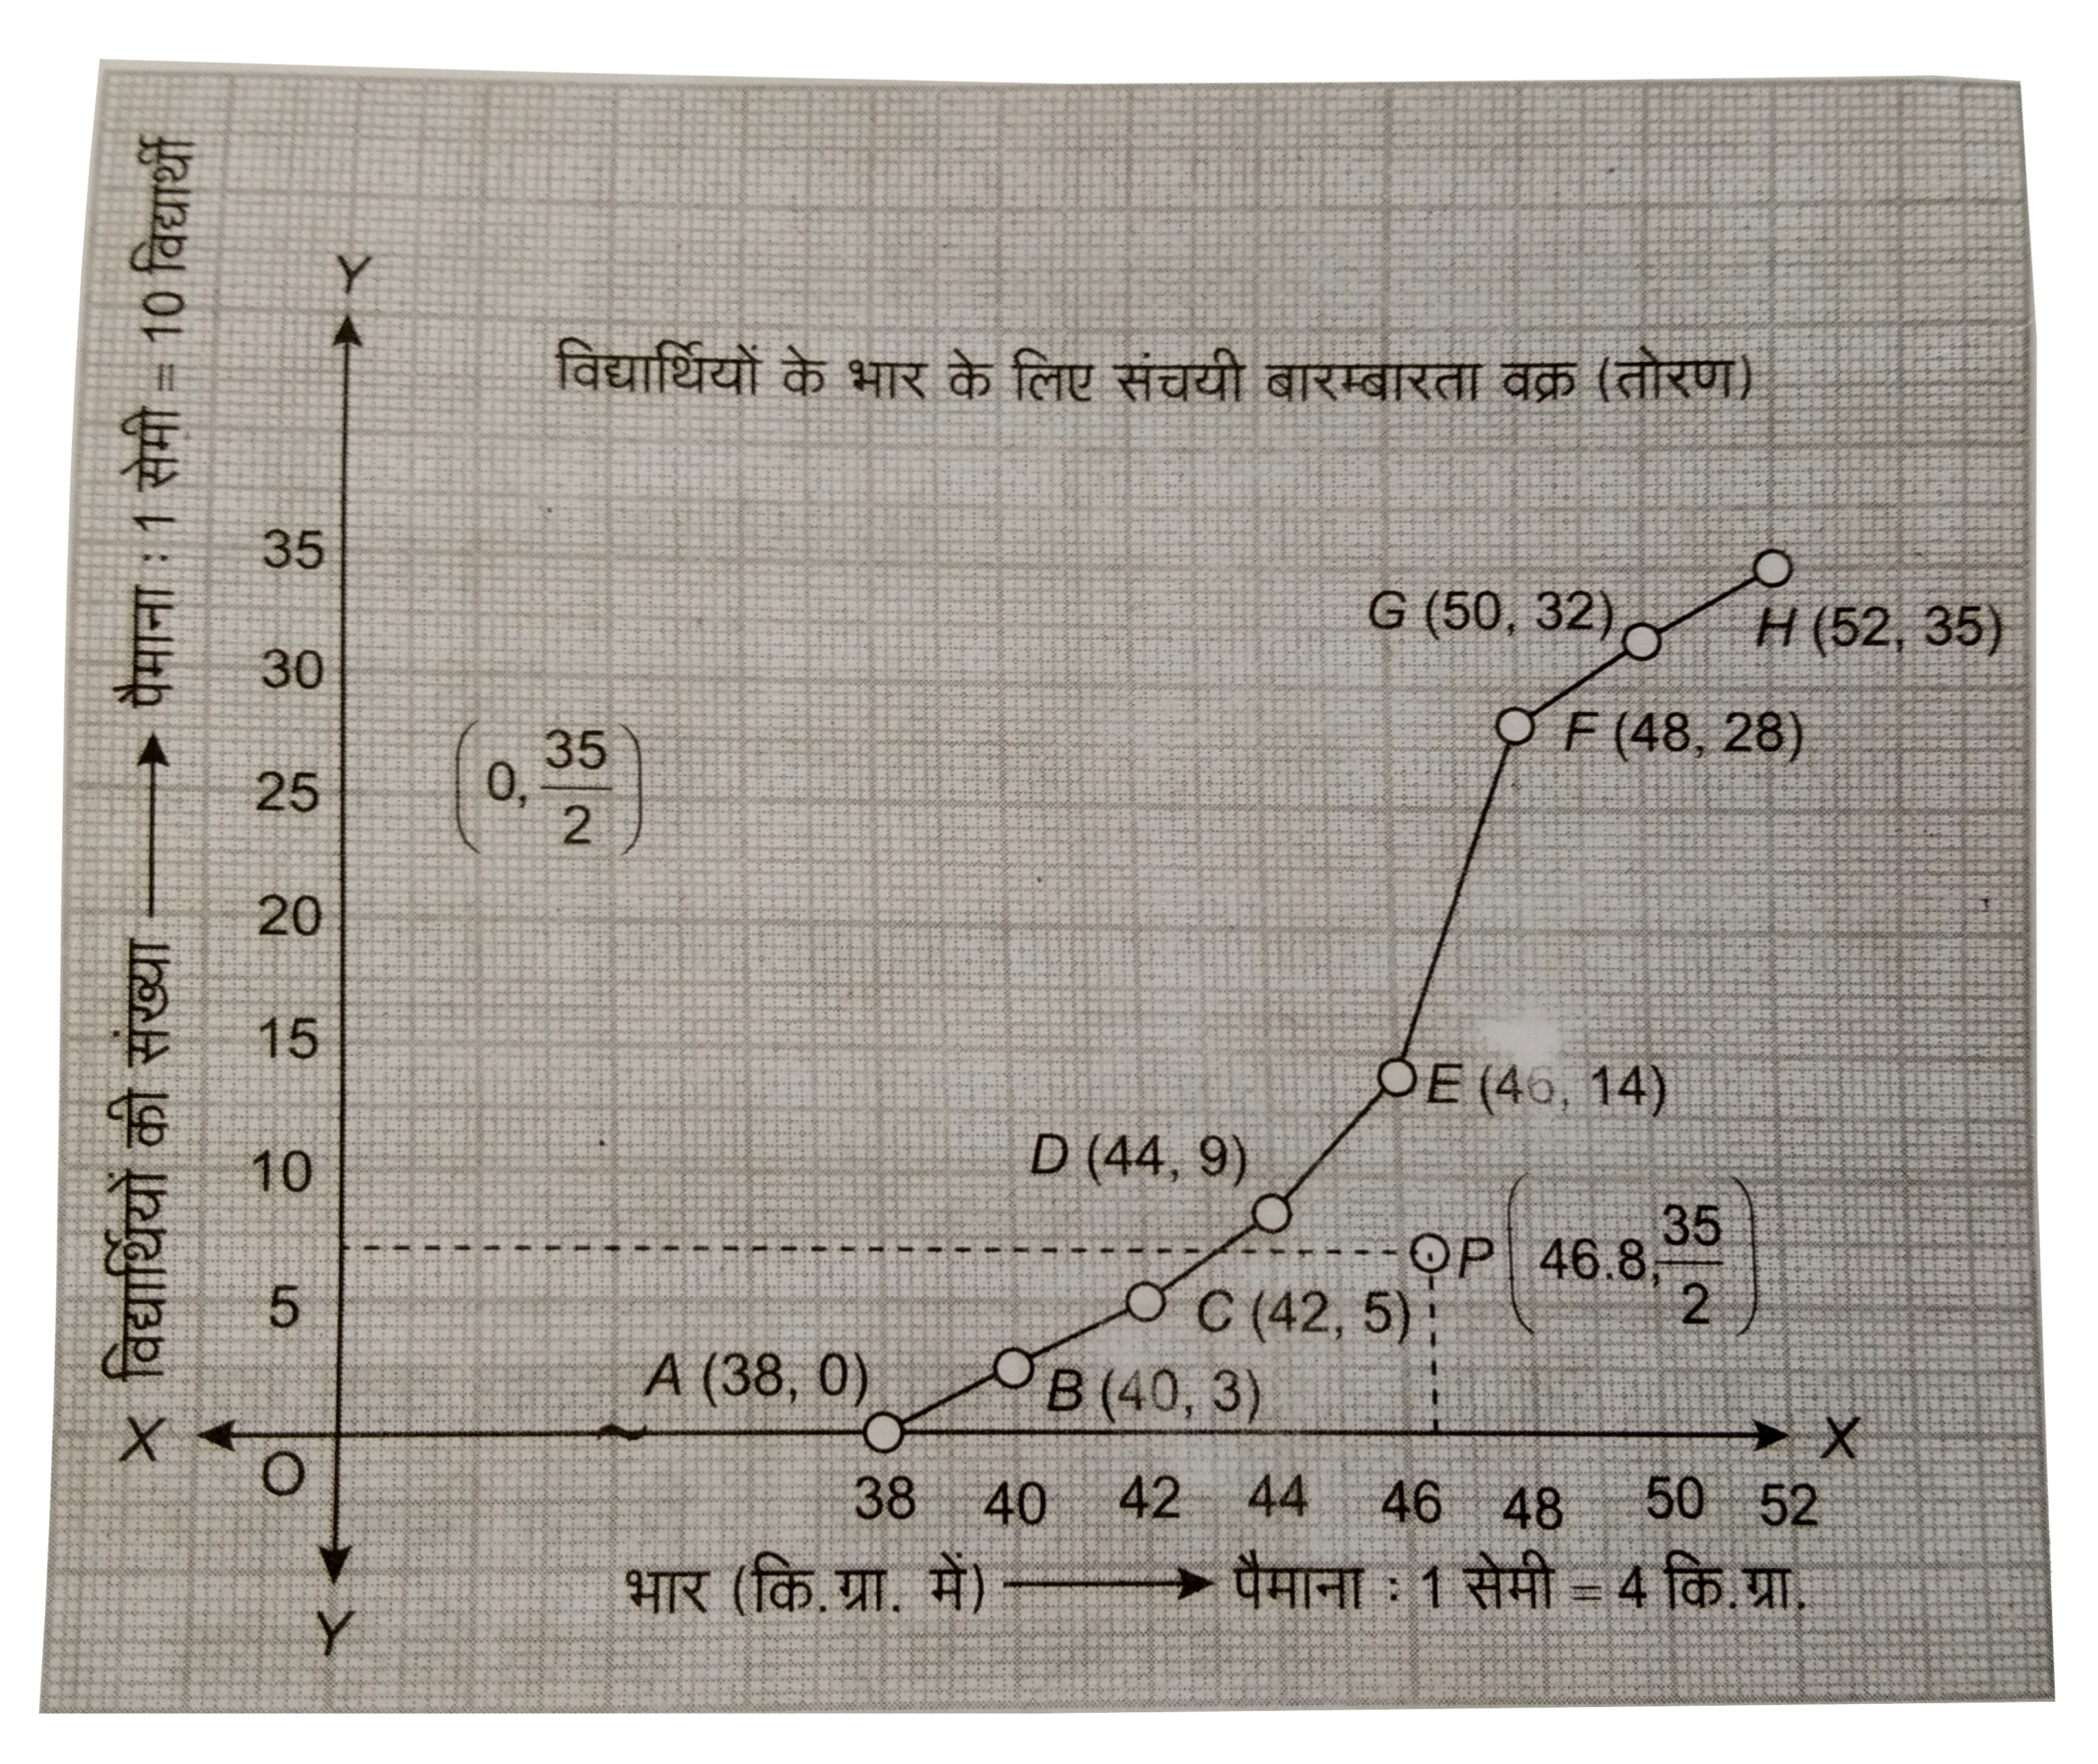
उपरोक्त आंकड़ों के लिए 'क्रम प्रकार का तोरण' खीचिए इसके बाद माध्यक भार ज्ञात कीजिए।


माध्यक ज्ञात करना : (1) Y- अक्ष पर बिंदु
(0,N2)≡(0,352) लीजिये
(2) बिंदु (0,352) से X- अक्ष के समान्तर रेखा खीचिए जो वक्र को P पर कटे बिंदु P ला भुज ज्ञात कीजिये पढ़िए यह 46.8 है
अतः अभीष्ट माध्यक = 46.8 कि.ग्रा.
Topper's Solved these Questions
- BOOK - NOOTAN HINDICHAPTER - सांख्यिकीEXERCISE - विविध प्रश्नावली19videos
सांख्यिकी
- BOOK - NOOTAN HINDICHAPTER - सांख्यिकीEXERCISE - बहुविकल्पीय प्रश्न7videos
सांख्यिकी
- BOOK - NOOTAN HINDICHAPTER - सांख्यिकीEXERCISE - प्रश्नावली 14.37videos
सांख्यिकी
- BOOK - NOOTAN HINDICHAPTER - समान्तर श्रेढ़ी EXERCISE - विविध प्रश्नावली ( बहुविकल्पीय प्रश्न )7videos
समान्तर श्रेढ़ी
Similar Questions
एक बंटन में 19 आंकड़े आरोही क्रम में है कौन-सा आंकड़ा मध्यिका को प्रदर्शित करता है
01:37View Solutionवर्गीकृत आंकड़ों का माध्य ज्ञात करने के लिए सूत्र ¯x=a+ΣfiΣfi में di निम्नलिखित के a विचलन है
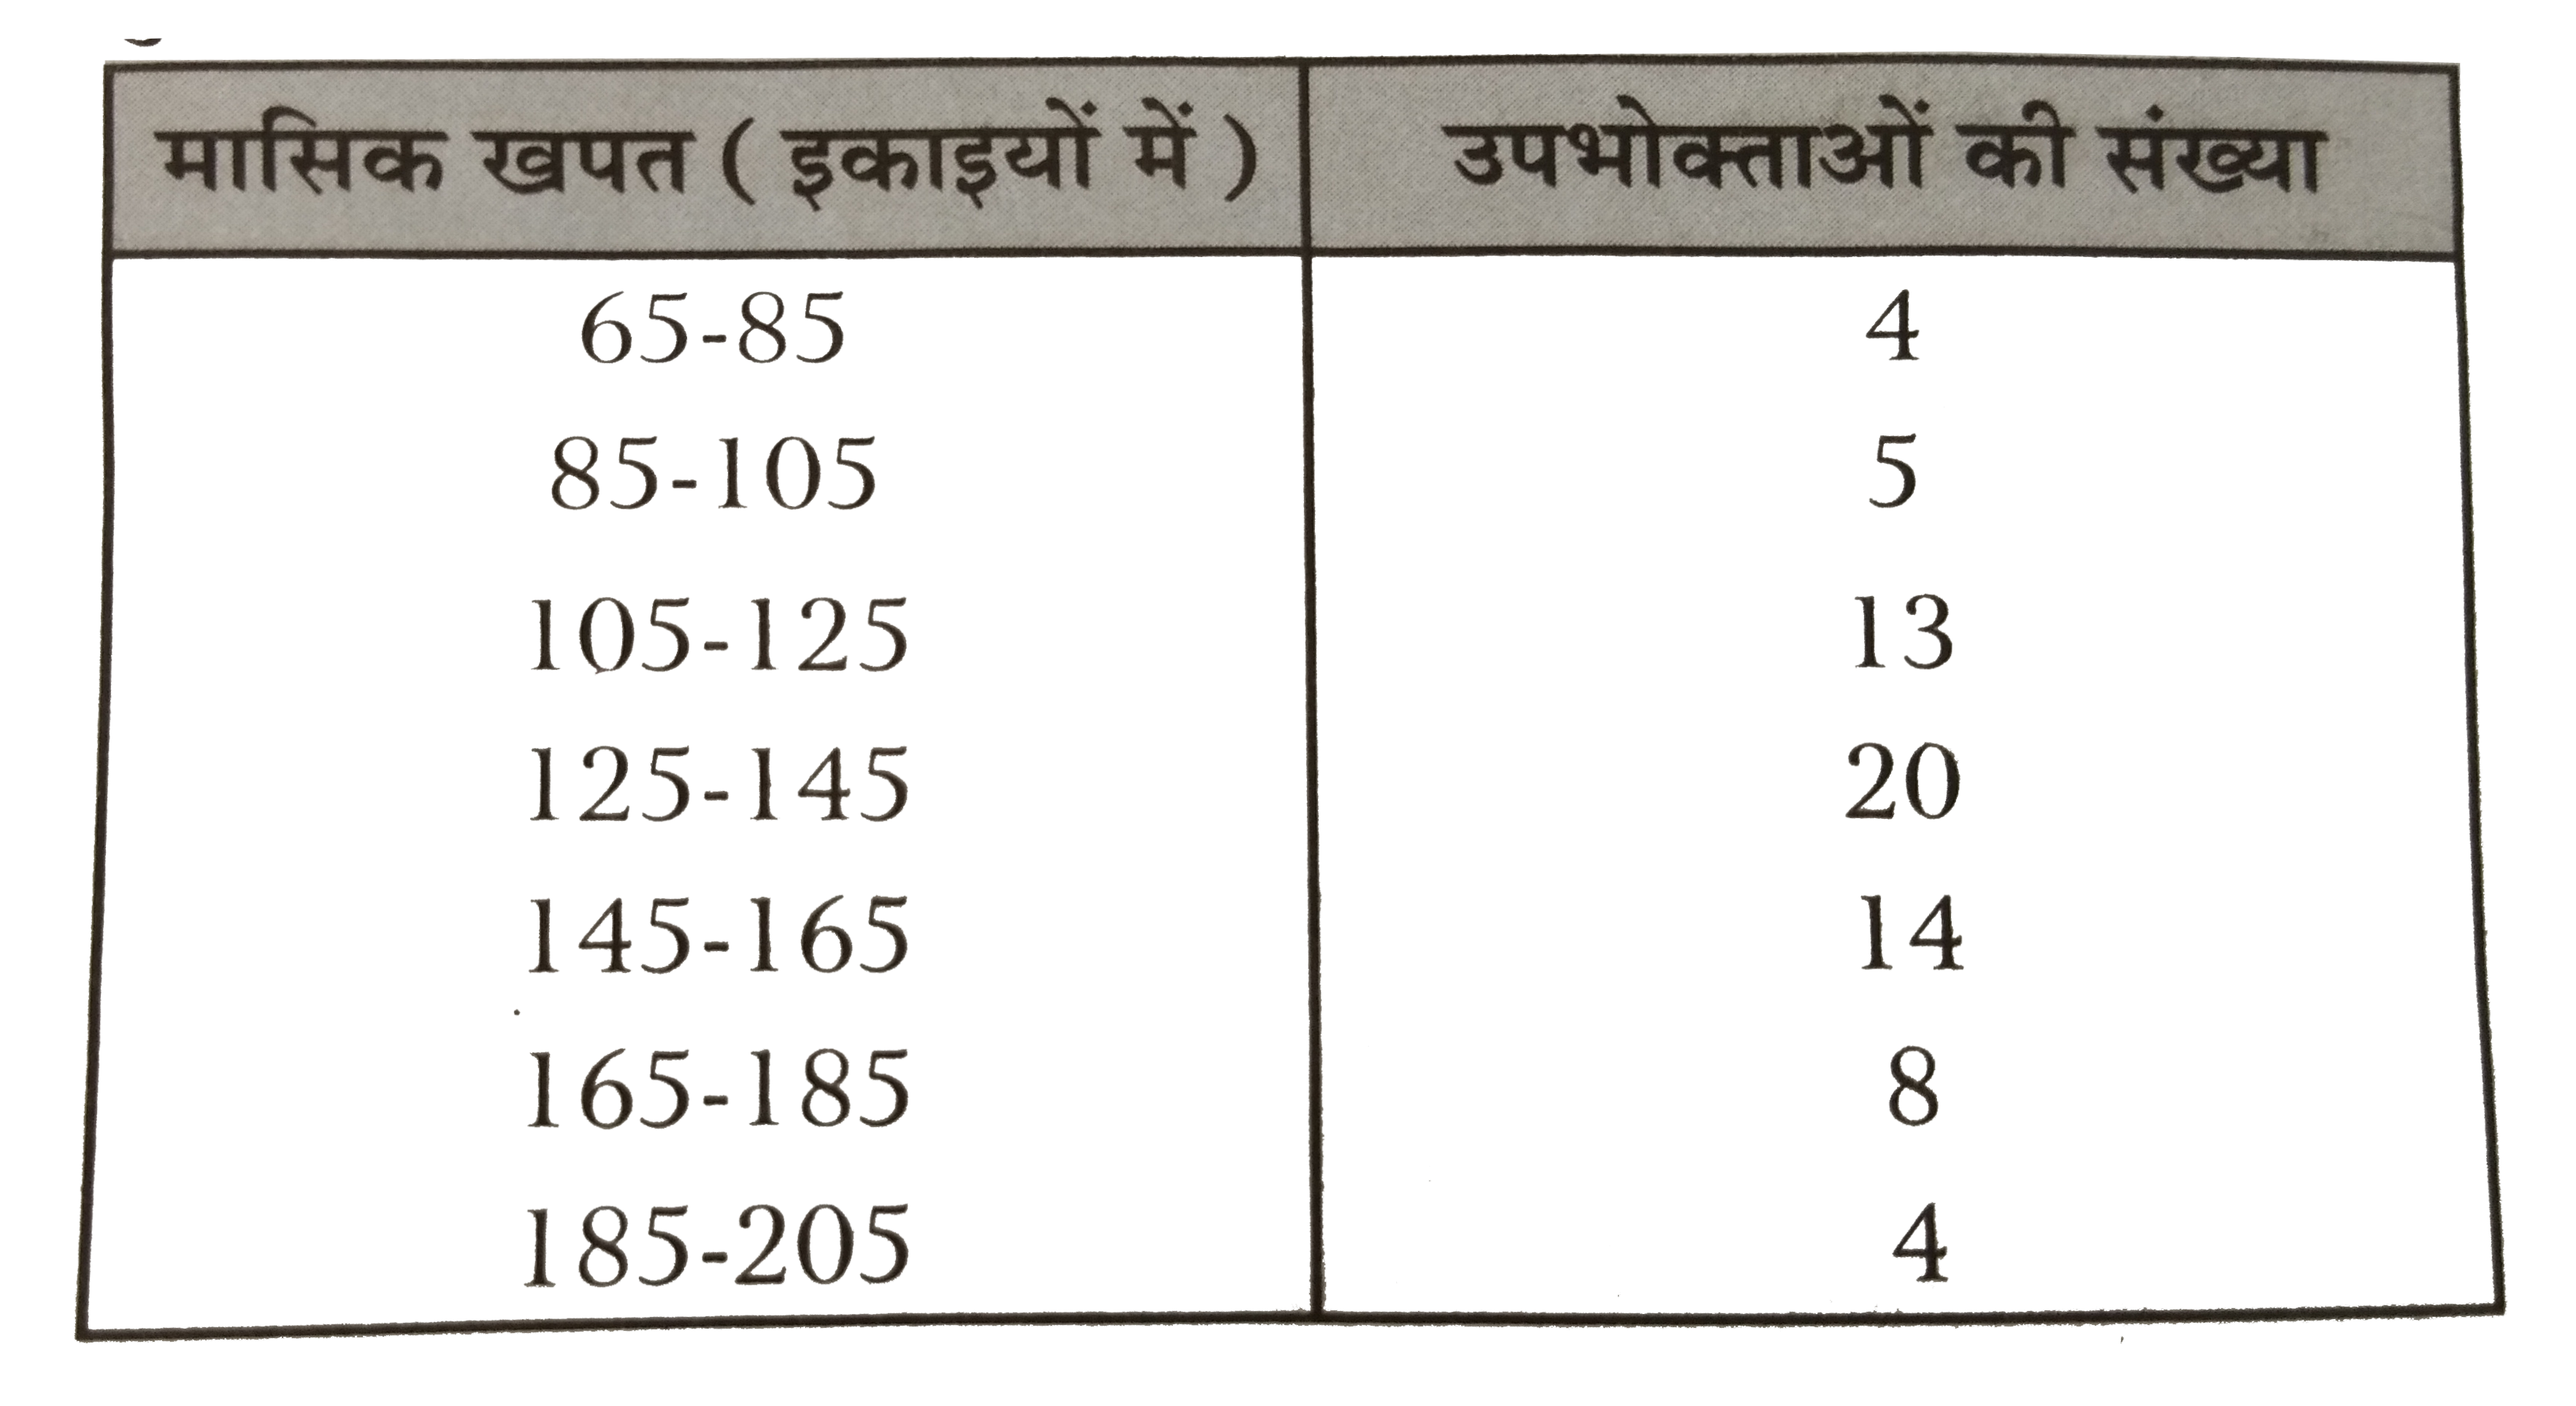
06:07View Solutionनिम्नलिखित बारम्बारता बंटन किसी मोहल्ले के 68 उपभोक्ताओं की बिजली की मासिक खपत दर्शाता है इन आंकड़ों के मध्यक, माध्य और बहुलक ज्ञात कीजिये इनकी तुलना कीजिये
 02:11View Solution
3 के प्रथम 6 गुणांकों का योग है:
01:31View SolutionHow many lines of symmetry does the above figure have ?
02:45View SolutionWhich of the following are correct chain isomers of butane ? (i)
02:17View SolutionDetermine the point of symmetry of a regular hexagon.
05:41View SolutionDtermine the images of the following figure about the given line :
02:21View SolutionMatch the following Column A to Column B
 02:03View Solution
Match the following Column A to Column B
 02:10View Solution
Match the following Column A to Column B
 02:17View Solution
Find the area of the figure given below.
 02:10View Solution
The area of the shaded part in the figure given below is ______.
 04:23View Solution
The inequation represented by the graph given below is :
01:13View SolutionThe inequation that best describes the graph given below is _________
03:12View SolutionThe inequation that best describes the following graph is _________
05:46View Solution

