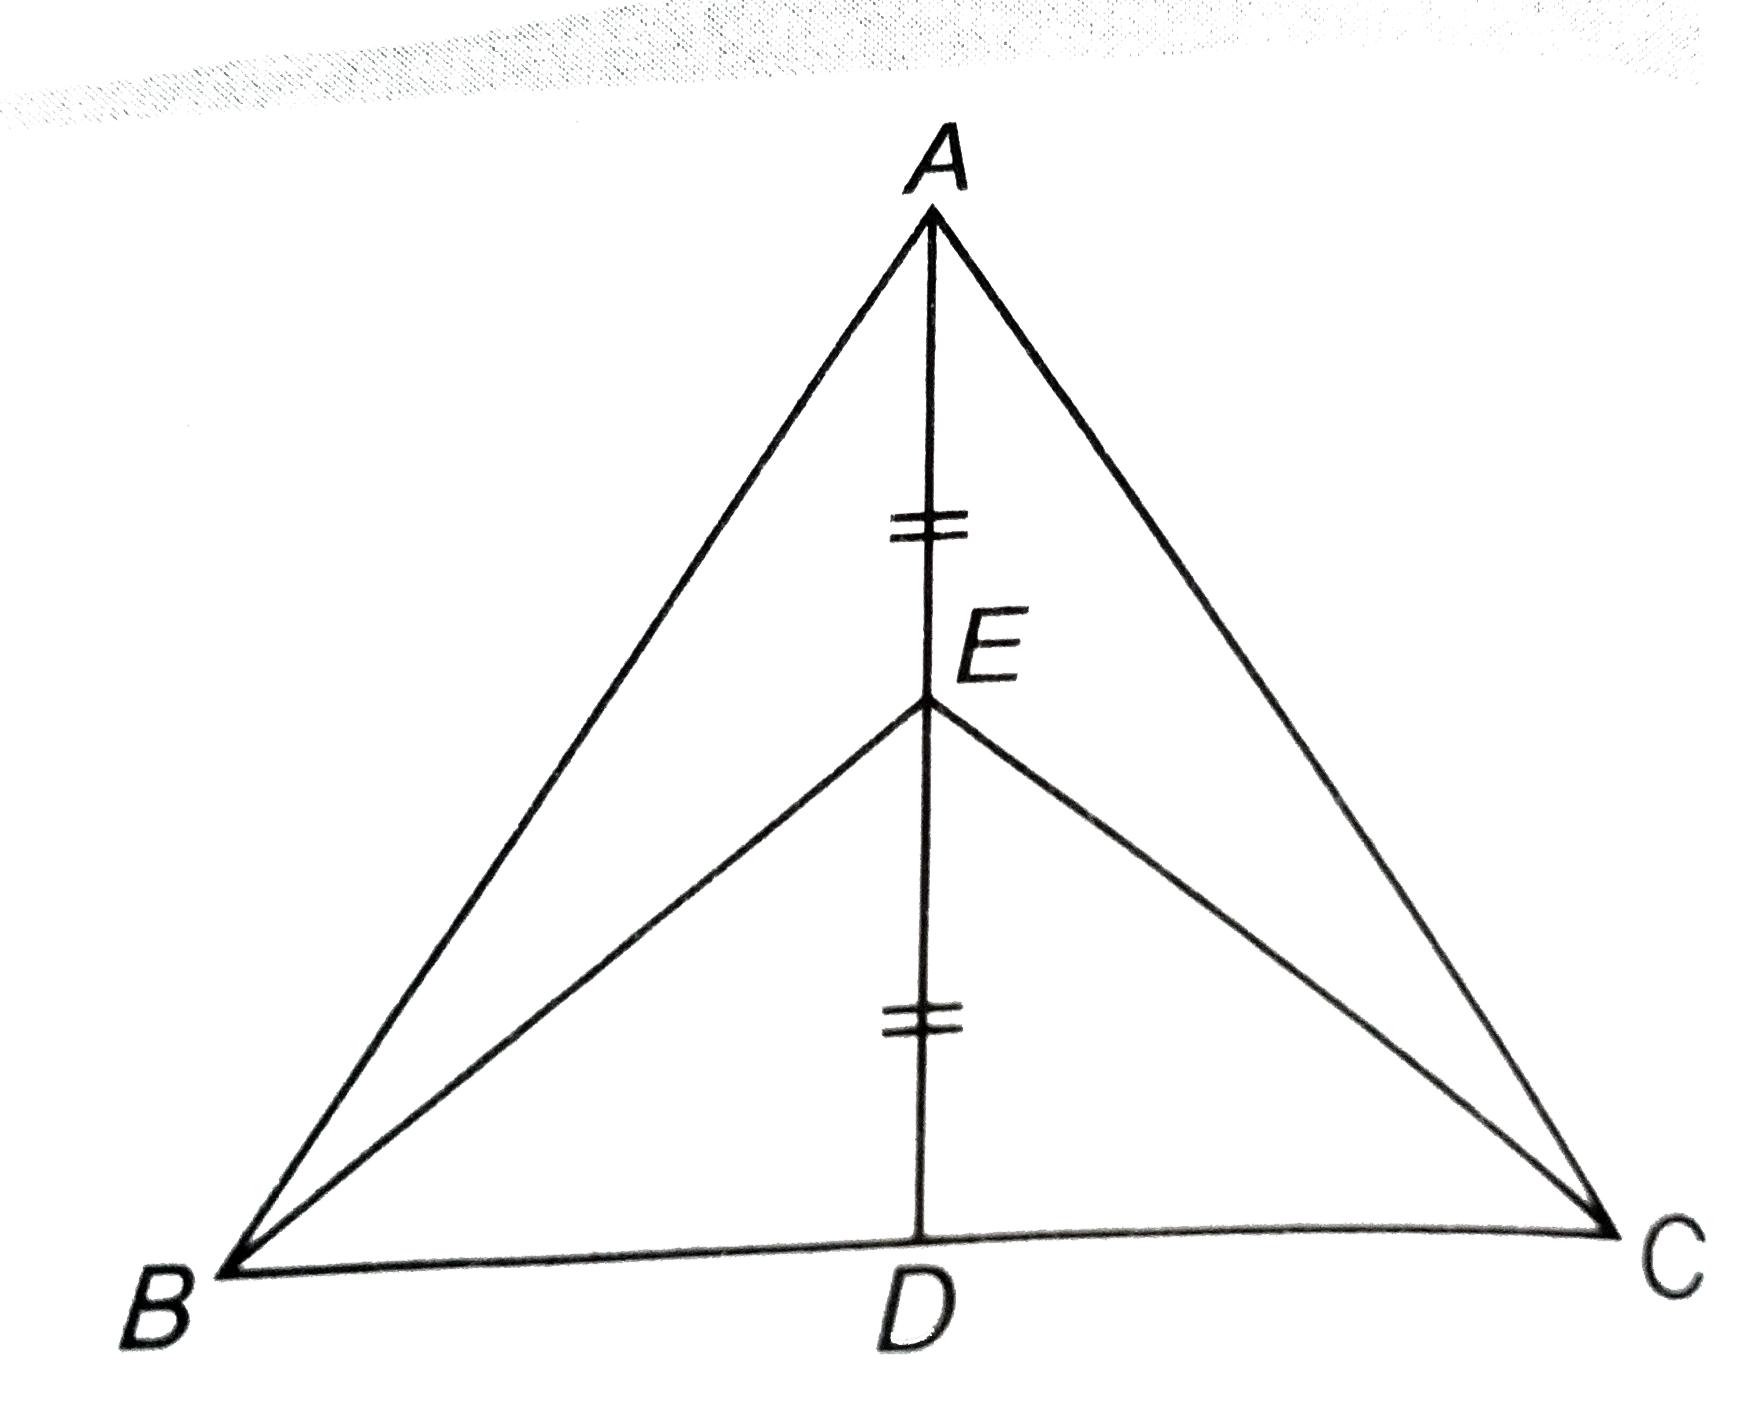
सलंग्न चित्र में, BD = DC और AE = ED है। सिद्ध कीजिए कि =

Step by step video & image solution for सलंग्न चित्र में, BD = DC और AE = ED है। सिद्ध कीजिए कि ar(DeltaACE)=(1)/(4)xxar(DeltaABC) by Maths experts to help you in doubts & scoring excellent marks in Class 9 exams.
Updated on:21/07/2023Topper's Solved these Questions
- समान्तर चतुर्भुजों और त्रिभुजों के क्षेत्रफल BOOK - NOOTAN HINDICHAPTER - समान्तर चतुर्भुजों और त्रिभुजों के क्षेत्रफल EXERCISE - दीर्घ उत्तरीय प्रश्न
5 Videos
- समान्तर चतुर्भुजों और त्रिभुजों के क्षेत्रफल BOOK - NOOTAN HINDICHAPTER - समान्तर चतुर्भुजों और त्रिभुजों के क्षेत्रफल EXERCISE - अतिलघु उत्तरीय प्रश्न
10 Videos
- चतुर्भुजBOOK - NOOTAN HINDICHAPTER - चतुर्भुजEXERCISE - विविध प्रश्नावली
24 Videos
Similar Questions
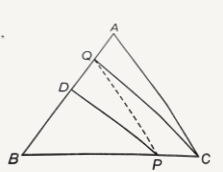
संलग्न चित्र में, ΔABC में AB का मध्य-बिन्दु D है तथा BC पर कोई बिन्दु P है। यदि CQ || PD, AB को Q पर मिलती है, तो सिद्ध कीजिए कि ar(ΔBPQ)=12ar(ΔABC)

View Solutionएक समचतुर्भुज के विकर्णों की लम्बाईयाँ 12 सेमी और 16 सेमी है। समचतुर्भुज का क्षेत्रफल ज्ञात कीजिए।
View Solutionएक चतुर्भुज के तीन कोण 100∘,98∘,92∘ है। चौथा कोण ज्ञात कीजिए।
View SolutionIdentify the cell organelle 'A' :-
ltimg src="https://d10lpgp6xz60nq.cloudfront.net/physics_images/ALN_BIO_C10_E08_018_Q01.png" width="80%"gt
View SolutionHow many lines of symmetry does the above figure have ?
View SolutionWhich of the following are correct chain isomers of butane ? (i)
View SolutionDetermine the point of symmetry of a regular hexagon.
View SolutionDtermine the images of the following figure about the given line :
View SolutionMatch the following Column A to Column B

View SolutionMatch the following Column A to Column B

View SolutionMatch the following Column A to Column B

View SolutionFind the area of the figure given below.

View SolutionThe area of the shaded part in the figure given below is ______.

View SolutionThe inequation represented by the graph given below is :
View SolutionThe inequation that best describes the graph given below is _________
View SolutionThe inequation that best describes the following graph is _________
View Solution
