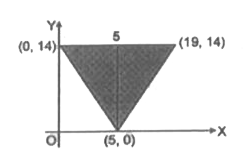
चित्र में दिखाए गए छायांकित क्षेत्र के लिए असामिका है-

14x+5y≥70,y≤14 और x−y≤5
14x+5y≥70,y≤14 और x−y≥5
14x+5y≤70,y≤14 और x−y≥5
14x+5y≥70,y≥14 और x−y≥5
The correct Answer is:B
Step by step video, text & image solution for चित्र में दिखाए गए छायांकित क्षेत्र के लिए असामिका है- by Maths experts to help you in doubts & scoring excellent marks in Class 12 exams.
Updated on:21/07/2023Topper's Solved these Questions
- रैखिक प्रोग्रामन BOOK - MITTAL PUBLICATIONCHAPTER - रैखिक प्रोग्रामन EXERCISE - CHECK YOUR POTENTIALITY
8 Videos
- रैखिक प्रोग्रामन BOOK - MITTAL PUBLICATIONCHAPTER - रैखिक प्रोग्रामन EXERCISE - LAST YEAR.S BOARD QUESTIONS
7 Videos
- प्रायिकता एवं प्रायिकता बंटन BOOK - MITTAL PUBLICATIONCHAPTER - प्रायिकता एवं प्रायिकता बंटन EXERCISE - CHECK YOUR POTENTIALITY
15 Videos
- व्यत्क्रम आव्यूह एव रेखिक समीकरणBOOK - MITTAL PUBLICATIONCHAPTER - व्यत्क्रम आव्यूह एव रेखिक समीकरणEXERCISE - Check Your Potentiality
10 Videos
Similar Questions
व्यवरोध x≥0,y≥0,x+y≤5 तथा 3x+y≤9 पर 12x+3y का अधिकतम मान है -
View Solutionनिम्न व्यवरोधों के अंतर्गत सुसंगत हल क्षेत्र उत्तर -पुस्तिका में दर्शाइए :
2x+y≥8,x≥0,y≥0
View SolutionA तथा B दो स्वतंत्र घटनाएँ है , यदि A और B दोनों के एक साथ घटने की प्रायिकता 16 तथा उनमे से किसी के नहीं घटने की प्रायिकता 13 हो , तो A के घटने की प्रायिकता होगी -
View Solutionसमीकरण का नियम जिसके लिए α की वास्तविक मानो की संख्या x+3y+5z=αx,5x+y+3z=αy,3x+5y+z=αz के अनंत हल है-
View SolutionHow many lines of symmetry does the above figure have ?
View SolutionWhich of the following are correct chain isomers of butane ? (i)
View SolutionDetermine the point of symmetry of a regular hexagon.
View SolutionDtermine the images of the following figure about the given line :
View SolutionMatch the following Column A to Column B

View SolutionMatch the following Column A to Column B

View SolutionMatch the following Column A to Column B

View SolutionFind the area of the figure given below.

View SolutionThe area of the shaded part in the figure given below is ______.

View SolutionThe inequation represented by the graph given below is :
View SolutionThe inequation that best describes the graph given below is _________
View SolutionThe inequation that best describes the following graph is _________
View Solution