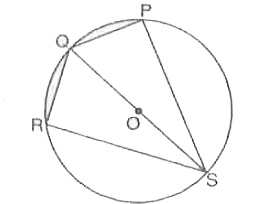
दी गई आकृति में, किसी वृत्त की दो जीवाएँ PQ और RQ केंद्र O से समान दुरी पर स्थित हैं| सिद्ध कीजिए कि व्यास QS कोणों PQR और PSR को समद्विभाजित करता है|

Step by step video & image solution for दी गई आकृति में, किसी वृत्त की दो जीवाएँ PQ और RQ केंद्र O से समान दुरी पर स्थित हैं| सिद्ध कीजिए कि व्यास QS कोणों PQR और PSR को समद्विभाजित करता है| by Maths experts to help you in doubts & scoring excellent marks in Class 9 exams.
Updated on:21/07/2023Topper's Solved these Questions
- वृत्त BOOK - MBD HINDI-HARYANA BOARDCHAPTER - वृत्त EXERCISE - बहुविकल्पी प्रश्न
8 Videos
- वृत्त BOOK - MBD HINDI-HARYANA BOARDCHAPTER - वृत्त EXERCISE - अभ्यास के लिए प्रश्न (लघु उत्तरात्मक प्रश्न)
21 Videos
- रेखाएँ और कोण BOOK - MBD HINDI-HARYANA BOARDCHAPTER - रेखाएँ और कोण EXERCISE - दीर्घ उत्तरीय प्रश्न
1 Videos
- संख्या पद्धति BOOK - MBD HINDI-HARYANA BOARDCHAPTER - संख्या पद्धति EXERCISE - बहुविकल्पी प्रश्न
22 Videos
Similar Questions
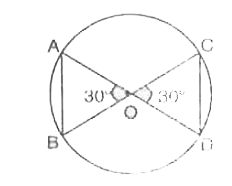
दी गई आकृति में AB = 5 सेमी है| जीवा CD की लम्बाई पता करो|

View SolutionAB और CD एक वृत्त की दो जीवाएं हैं, जहाँ AB = 6 cm, CD = 12 cm है और AB, CD के समांतर है| AB और CD के बीच की दुरी 3 cm है| वृत्त की त्रिज्या ज्ञात कीजिए |
View Solutionयदि दो रेखाएँ परस्पर प्रतिच्छेद करें, तो शीर्षभिमुख कोण समान होते हैं।
View Solutionपरिमेय संख्या 340 बराबर है |
View SolutionHow many lines of symmetry does the above figure have ?
View SolutionWhich of the following are correct chain isomers of butane ? (i)
View SolutionDetermine the point of symmetry of a regular hexagon.
View SolutionDtermine the images of the following figure about the given line :
View SolutionMatch the following Column A to Column B

View SolutionMatch the following Column A to Column B

View SolutionMatch the following Column A to Column B

View SolutionFind the area of the figure given below.

View SolutionThe area of the shaded part in the figure given below is ______.

View SolutionThe inequation represented by the graph given below is :
View SolutionThe inequation that best describes the graph given below is _________
View SolutionThe inequation that best describes the following graph is _________
View Solution
