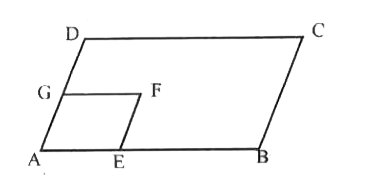
चित्र में ABCD और AEFG दो समान्तर चतुर्भुज है । यदि ∠C=70∘ है तो ∠F का मान ज्ञात कीजिए।

The correct Answer is:∠F=70∘
Step by step video, text & image solution for चित्र में ABCD और AEFG दो समान्तर चतुर्भुज है । यदि /_C=70^(@) है तो /_F का मान ज्ञात कीजिए। by Maths experts to help you in doubts & scoring excellent marks in Class 9 exams.
Updated on:21/07/2023Topper's Solved these Questions
- चतुर्भुज BOOK - SCIENCE PUBLICATIONCHAPTER - चतुर्भुज EXERCISE - प्रश्नावली 8.2
11 Videos
- चतुर्भुज BOOK - SCIENCE PUBLICATIONCHAPTER - चतुर्भुज EXERCISE - प्रश्नावली 8.2 पर आधारित अभ्यास प्रश्न
7 Videos
- चतुर्भुज BOOK - SCIENCE PUBLICATIONCHAPTER - चतुर्भुज EXERCISE - प्रश्नावली 8.1
17 Videos
- त्रिभुज BOOK - SCIENCE PUBLICATIONCHAPTER - त्रिभुज EXERCISE - प्रश्नावली 7.4
6 Videos
Similar Questions
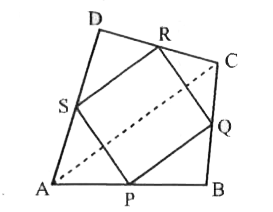
ABCD एक चतुर्भुज है जिसमें P, Q, R और S क्रमशः भुजाओं AB, BC, CD और DA के मध्य बिन्दु हैं ( देखिए आकृति)। AC उसका एक विकर्ण हैं। दर्शाइए कि-
SR || AC और SR=12AC है।

View SolutionP, Q और R क्रमशः एक समबाहु त्रिभुज ABC की भुजाओं BC, CA और AB के मध्य बिन्दु है। सिद्ध कीजिए कि ΔPQR भी एक समबाहु त्रिभुज हैं।
View Solutionएक चतुर्भुज के कोण 3 : 5 : 9 : 13 के अनुपात में हैं। इस चतुर्भुज के सभी कोण ज्ञात कीजिए।
View Solutionदर्शाइए क समकोण त्रिभुज में कोण सबसे लम्बी भुजा होती है |
View SolutionHow many lines of symmetry does the above figure have ?
View SolutionWhich of the following are correct chain isomers of butane ? (i)
View SolutionDetermine the point of symmetry of a regular hexagon.
View SolutionDtermine the images of the following figure about the given line :
View SolutionMatch the following Column A to Column B

View SolutionMatch the following Column A to Column B

View SolutionMatch the following Column A to Column B

View SolutionFind the area of the figure given below.

View SolutionThe area of the shaded part in the figure given below is ______.

View SolutionThe inequation represented by the graph given below is :
View SolutionThe inequation that best describes the graph given below is _________
View SolutionThe inequation that best describes the following graph is _________
View Solution
