इन ठोसों के लिए आयलर सूत्र का सत्यापन कीजिए:

Step by step video & image solution for इन ठोसों के लिए आयलर सूत्र का सत्यापन कीजिए: by Maths experts to help you in doubts & scoring excellent marks in Class 8 exams.
Updated on:21/07/2023Topper's Solved these Questions
Similar Questions
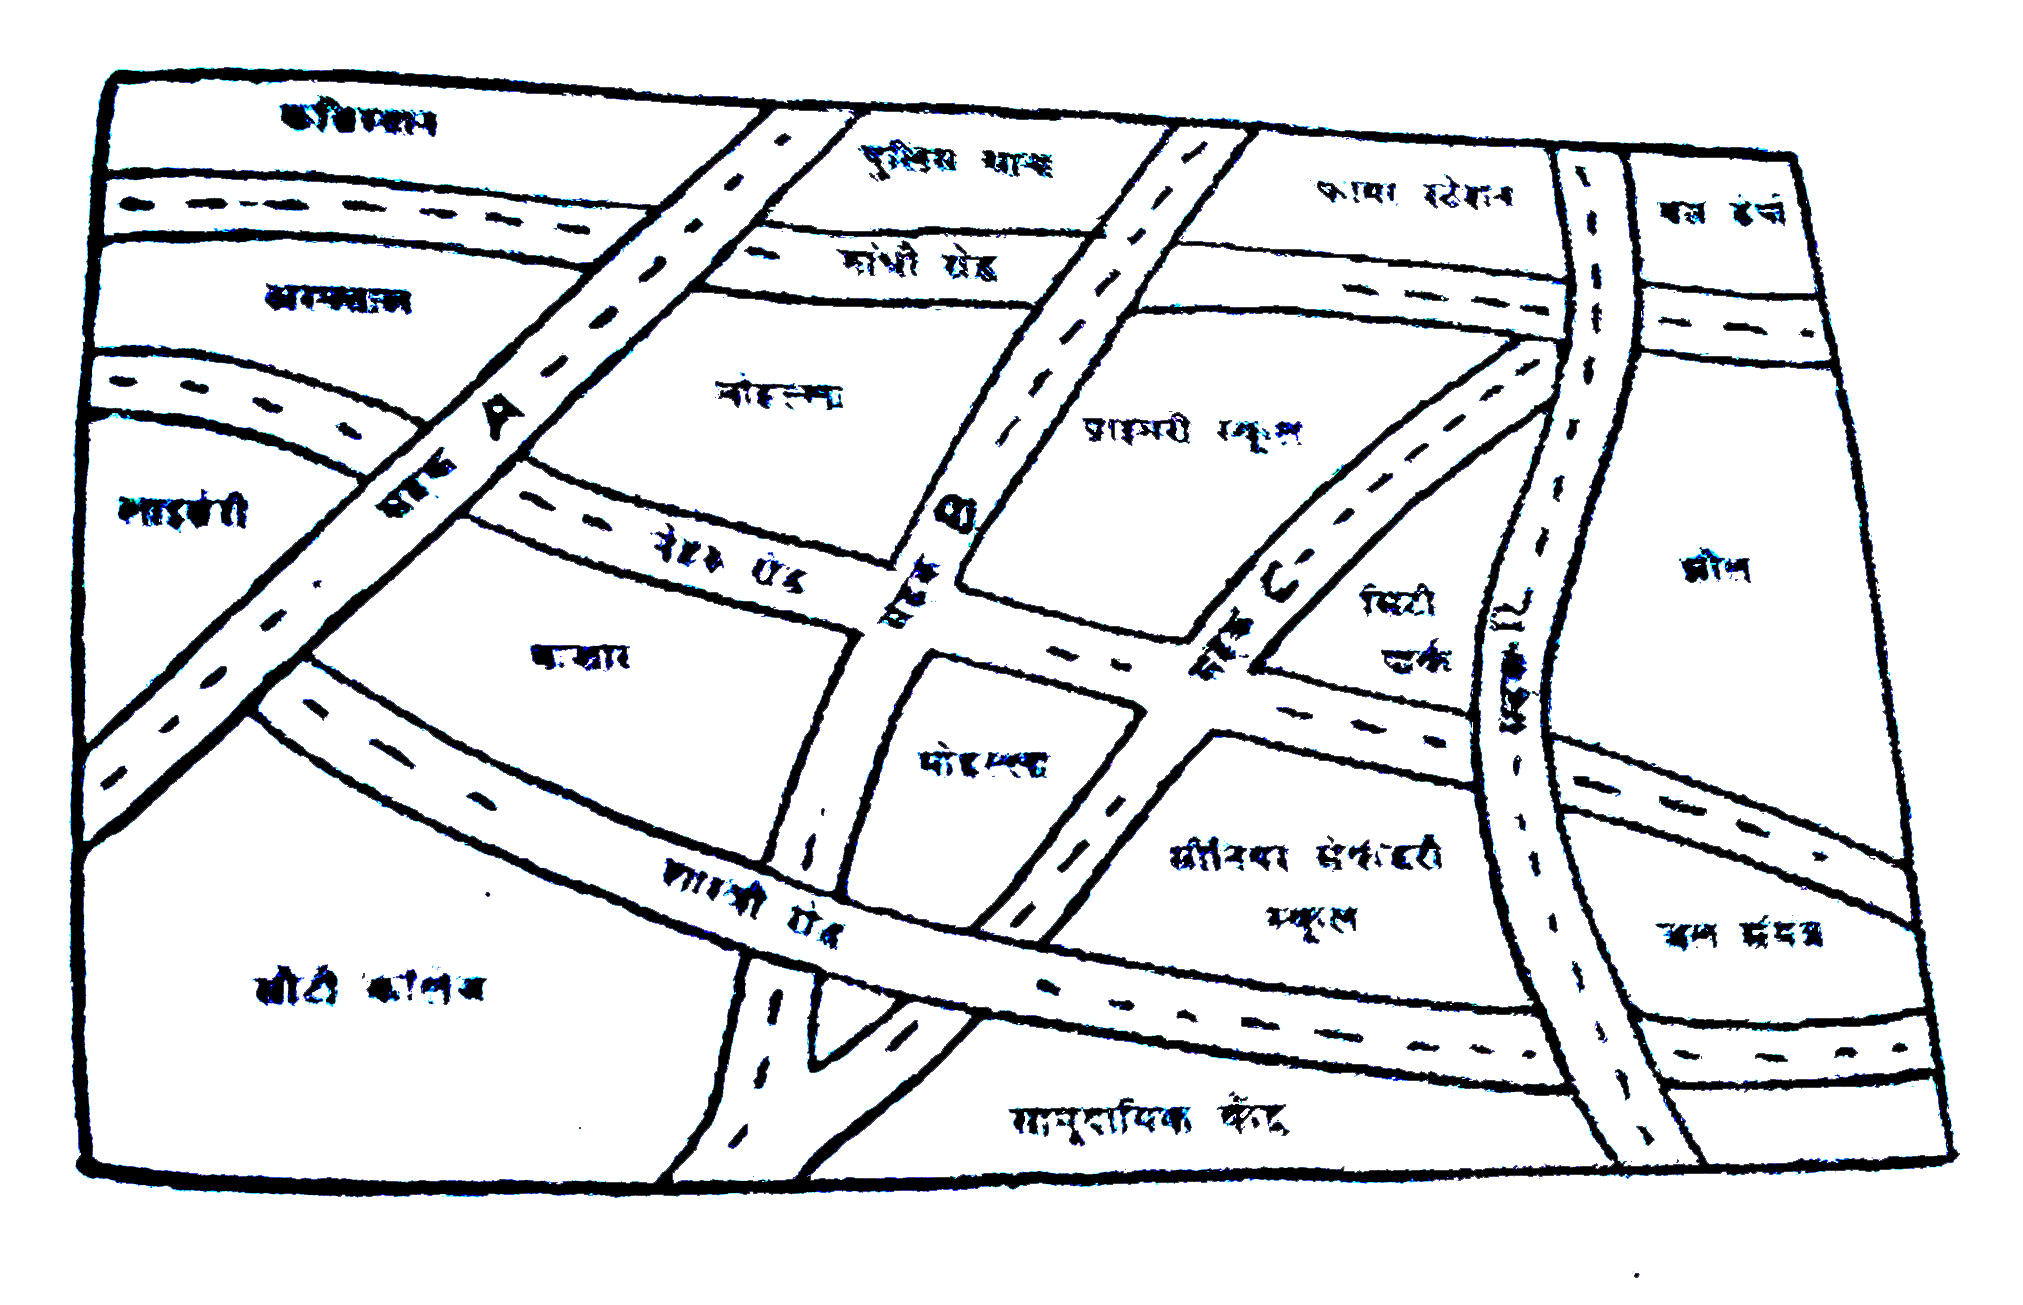
एक नगर के दिए हुए मानचित्र को देखिए। निम्नलिखित प्रश्नों के उत्तर दीजिए :
(a) इस मानचित्र में इस प्रकार रंग भरिए : नीला - जल, लाल - फायर-स्टेशन: नारंगी - लाइब्रेरी, पीला - स्कूल, हरा - पार्क, गुलाबी - कॉलेज, बैंगनी - अस्पताल, भूरा - कब्रिस्तान।
(b) सड़क C और नेहरू रोड के प्रतिच्छेदन पर एक हरा 'X ' तथा गांधी रोड और सड़क A के प्रतिच्छेदन पर एक हरा 'Y ' खींचिए ।
(c ) लाइब्रेरी से बस डिपो तक एक छोटा सड़क मार्ग लाल रंग से खींचिए।
(d) कौन अधिक पूर्व में है - सिटी पार्क या बाजार ?
(e ) कौन अधिक दक्षिण में है? - प्राइमरी स्कूल या सीनियर सैकेंडरी स्कूल?

View Solutionबताइए, कथन सत्य है या असत्य :
(a) सभी आयत वर्ग होते है
(b) सभी सम चतुर्भुज समांतर चतुर्भुज होते हैं
(c) सभी वर्ग सम चतुर्भुज और आयत
(d) सभी वर्ग समांतर चतुर्भुज नहीं होते |
(e) सभी पतंगे सम चतुर्भुज होती है
(f) सभी सम चतुर्भुज समलम्ब होते है |
(h) सभी वर्ग समलंब होते हैं |
View Solutionनिम्नलिखित संख्याओं को संख्या रेखा पर निरूपित कीजिए : (i) 74 (ii) −56
View SolutionHow many lines of symmetry does the above figure have ?
View SolutionWhich of the following are correct chain isomers of butane ? (i)
View SolutionDetermine the point of symmetry of a regular hexagon.
View SolutionDtermine the images of the following figure about the given line :
View SolutionMatch the following Column A to Column B

View SolutionMatch the following Column A to Column B

View SolutionMatch the following Column A to Column B

View SolutionFind the area of the figure given below.

View SolutionThe area of the shaded part in the figure given below is ______.

View SolutionThe inequation represented by the graph given below is :
View SolutionThe inequation that best describes the graph given below is _________
View SolutionThe inequation that best describes the following graph is _________
View SolutionWhich inequations represent the shaded region in the given figure
View Solution
