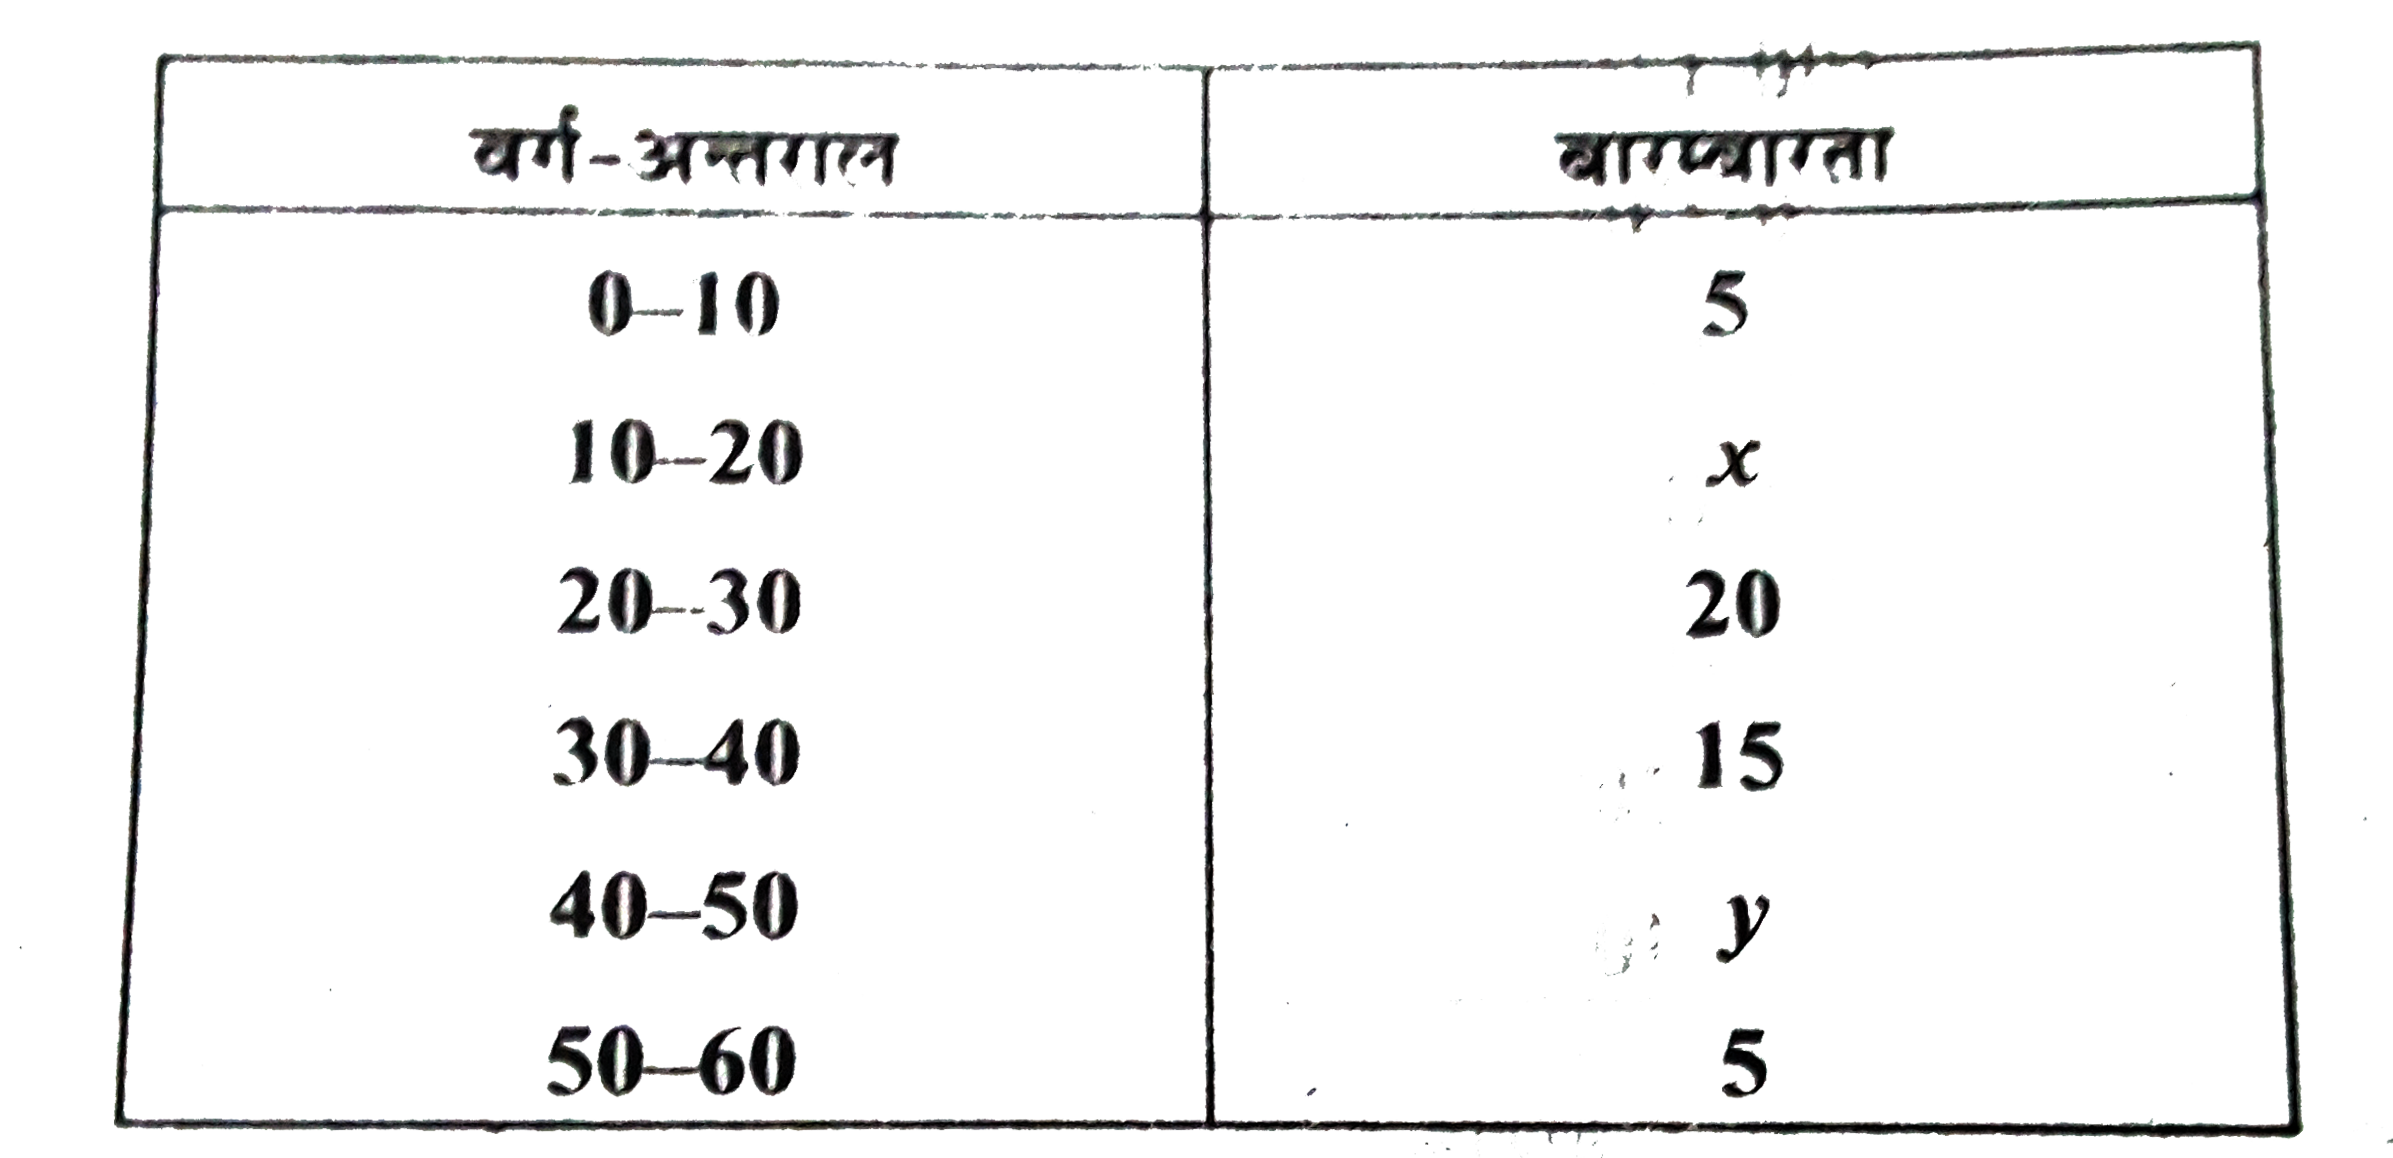
दिये गये आवृति वितरण के आँकड़ो का माध्यक ( माध्यिका ) 28.5 है तो x और y के मान ज्ञात कीजिए , जबकि बारम्बारताओ का योग 60 है ।

Step by step video & image solution for दिये गये आवृति वितरण के आँकड़ो का माध्यक ( माध्यिका ) 28.5 है तो x और y के मान ज्ञात कीजिए , जबकि बारम्बारताओ का योग 60 है । by Maths experts to help you in doubts & scoring excellent marks in Class 10 exams.
Topper's Solved these Questions
- BOOK - UP BOARD PREVIOUS YEARCHAPTER - सांख्यिकी EXERCISE - बहुविकल्पीय प्रश्नोत्तर?10videos
सांख्यिकी
- BOOK - UP BOARD PREVIOUS YEARCHAPTER - सांख्यिकी EXERCISE - अतिलघु उत्तरीय प्रश्नोत्तर15videos
सांख्यिकी
- BOOK - UP BOARD PREVIOUS YEARCHAPTER - सांख्यिकी EXERCISE - प्रश्नोत्तर25videos
सांख्यिकी
- BOOK - UP BOARD PREVIOUS YEARCHAPTER - समान्तर श्रेणियाँEXERCISE - दीर्घ उत्तरीय प्रश्न3videos
समान्तर श्रेणियाँ
- BOOK - UP BOARD PREVIOUS YEARCHAPTER - हाई स्कूल परीक्षा 2012 गणित EXERCISE - गणित 822(CN)10videos
हाई स्कूल परीक्षा 2012 गणित
Similar Questions
1,2,3,7,2,7,5,3,7 का बहुलक है:
01:37View Solutionयदि 5, 10, 15, R, 20, 35 और 40 का समान्तर माध्य 21 है, R का मान ज्ञात कीजिए।
06:07View Solution1 से 10 तक की धनात्मक सम संख्याओं का समान्तर माध्य होगा।
02:11View Solution636 योगफल प्राप्त करने के लिए श्रेणी 9,17,25,…. के कितने पद लेने चाहिए ?
01:31View Solutionद्विघात समीकरण 3x2−7−5x=0 के मूलों का गुणनफल होगा
02:45View SolutionHow many lines of symmetry does the above figure have ?
02:17View SolutionWhich of the following are correct chain isomers of butane ? (i)
05:41View SolutionDetermine the point of symmetry of a regular hexagon.
02:21View SolutionDtermine the images of the following figure about the given line :
02:10View SolutionMatch the following Column A to Column B
 02:17View Solution
Match the following Column A to Column B
 02:10View Solution
Match the following Column A to Column B
 04:23View Solution
Find the area of the figure given below.
 01:13View Solution
The inequation represented by the graph given below is :
01:50View SolutionThe inequation that best describes the graph given below is _________
01:10View SolutionThe inequation that best describes the following graph is _________
02:34View Solution

