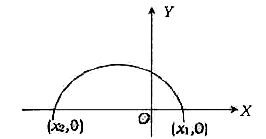
चित्र द्वारा y=ax2+bx+c का ग्राफ प्रदर्शित है, तब

a>0
b<0
c>0
b2−4ac=0
The correct Answer is:B, C
Step by step video, text & image solution for चित्र द्वारा y=ax^(2)+bx+c का ग्राफ प्रदर्शित है, तब by Maths experts to help you in doubts & scoring excellent marks in Class 12 exams.
Topper's Solved these Questions
- BOOK - ERRORLESS HINDICHAPTER - वर्ग समीकरण एवं असमिकायें EXERCISE - JEE Advanced (More than one correct answers)17videos
वर्ग समीकरण एवं असमिकायें
- BOOK - ERRORLESS HINDICHAPTER - वर्ग समीकरण एवं असमिकायें EXERCISE - JEE Advanced (Reasoning type questions)4videos
वर्ग समीकरण एवं असमिकायें
- BOOK - ERRORLESS HINDICHAPTER - वर्ग समीकरण एवं असमिकायें EXERCISE - Solved Multiple Choice Questions (वर्ग असमीकरण के हल और विविध समीकरण)27videos
वर्ग समीकरण एवं असमिकायें
- BOOK - ERRORLESS HINDICHAPTER - लघुगणक और आंशिक भिन्नें EXERCISE - JEE Advanced (integer type questions)8videos
लघुगणक और आंशिक भिन्नें
- BOOK - ERRORLESS HINDICHAPTER - वृत्त तथा वृत्तों का निकाय EXERCISE - JEE Advanced (Integer type questions)20videos
वृत्त तथा वृत्तों का निकाय
Similar Questions
यदि S सभी वास्तविक x का समुच्चय इस प्रकार है कि 2x−12x3+3x2+x धनात्मक है, तब S निम्न में से किस अंतराल में अन्तर्विष्ट है
01:37View Solutionमाना a,b,c,p,q वास्तविक संख्याएँ हैं | माना α,β समीकरण x2+2px+q=0 के मूल हैं तथा α,1β समीकरण ax2+2bx+c=0 के मूल हैं, जहाँ beta^(2)cancel in{-1,0,1}
कथन-1 : (p2−q)(b2−ac)≥0
कथन-2 : b≠pq या c≠qa.06:07View Solutionसभी x का समुच्चय जो असमिका 4x−13x+1≥1 को संतुष्ट करता है
02:11View Solutionपद 6+log32⎛⎜ ⎜⎝13√2 ⎷4−13√2 ⎷4−13√2√4−13√2…⎞⎟ ⎟⎠ का मान है
01:31View Solutionरेखा 2x−3y=1 वृत्तीय क्षेत्र x2+y2≤6 को दो भागों में विभाजित करती है। यदि
S={(2,34),(52,34),(14,−14),(18,14)}, तो S में स्थित उन बिन्दुओं की संख्या जो लघुत्तर भाग में अन्दर है, निम्न है02:45View SolutionHow many lines of symmetry does the above figure have ?
02:17View SolutionWhich of the following are correct chain isomers of butane ? (i)
05:41View SolutionDetermine the point of symmetry of a regular hexagon.
02:21View SolutionDtermine the images of the following figure about the given line :
02:03View SolutionMatch the following Column A to Column B
 02:10View Solution
Match the following Column A to Column B
 02:17View Solution
Match the following Column A to Column B
 02:10View Solution
Find the area of the figure given below.
 04:23View Solution
The area of the shaded part in the figure given below is ______.
 01:13View Solution
The inequation represented by the graph given below is :
03:12View SolutionThe inequation that best describes the graph given below is _________
05:46View Solution

