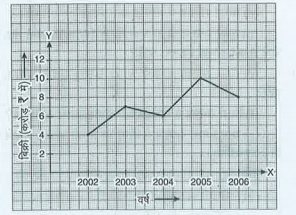
एक निर्माता कम्पनी की विभिन्न वर्षों में की गई बिक्री निम्न आलेख द्वारा दर्शाई गई है :

वर्ष 2002 में कितनी विक्री थी?
Step by step video & image solution for एक निर्माता कम्पनी की विभिन्न वर्षों में की गई बिक्री निम्न आलेख द्वारा दर्शाई गई है : वर्ष 2002 में कितनी विक्री थी? by Maths experts to help you in doubts & scoring excellent marks in Class 8 exams.
Topper's Solved these Questions
Similar Questions
नीचे एक चित्रालेख (pictograph): संकेतों का प्रयोग करते हुए, आंकड़ों का चित्रीय निरूपण किया गया है ।
ज्ञात कीजिए कि जुलाई के महीने में कितनी कारों का उत्पादन हुआ ? 01:37View Solution
निम्न समीकरणों को हल कीजिए- x−2=7
06:07View SolutionHow many lines of symmetry does the above figure have ?
02:11View SolutionWhich of the following are correct chain isomers of butane ? (i)
01:31View SolutionDetermine the point of symmetry of a regular hexagon.
02:45View SolutionDtermine the images of the following figure about the given line :
02:17View SolutionMatch the following Column A to Column B
 05:41View Solution
Match the following Column A to Column B
 02:21View Solution
Match the following Column A to Column B
 02:03View Solution
Find the area of the figure given below.
 02:10View Solution
The area of the shaded part in the figure given below is ______.
 02:17View Solution
The inequation represented by the graph given below is :
02:10View SolutionThe inequation that best describes the graph given below is _________
04:23View SolutionThe inequation that best describes the following graph is _________
01:13View SolutionWhich inequations represent the shaded region in the given figure
03:12View SolutionIn Fig, find the value of x.
ltimg src="https://d10lpgp6xz60nq.cloudfront.net/physics_images/PS_MATH_IX_C12_S01_032_Q01.png" width="80%"gt05:46View Solution

