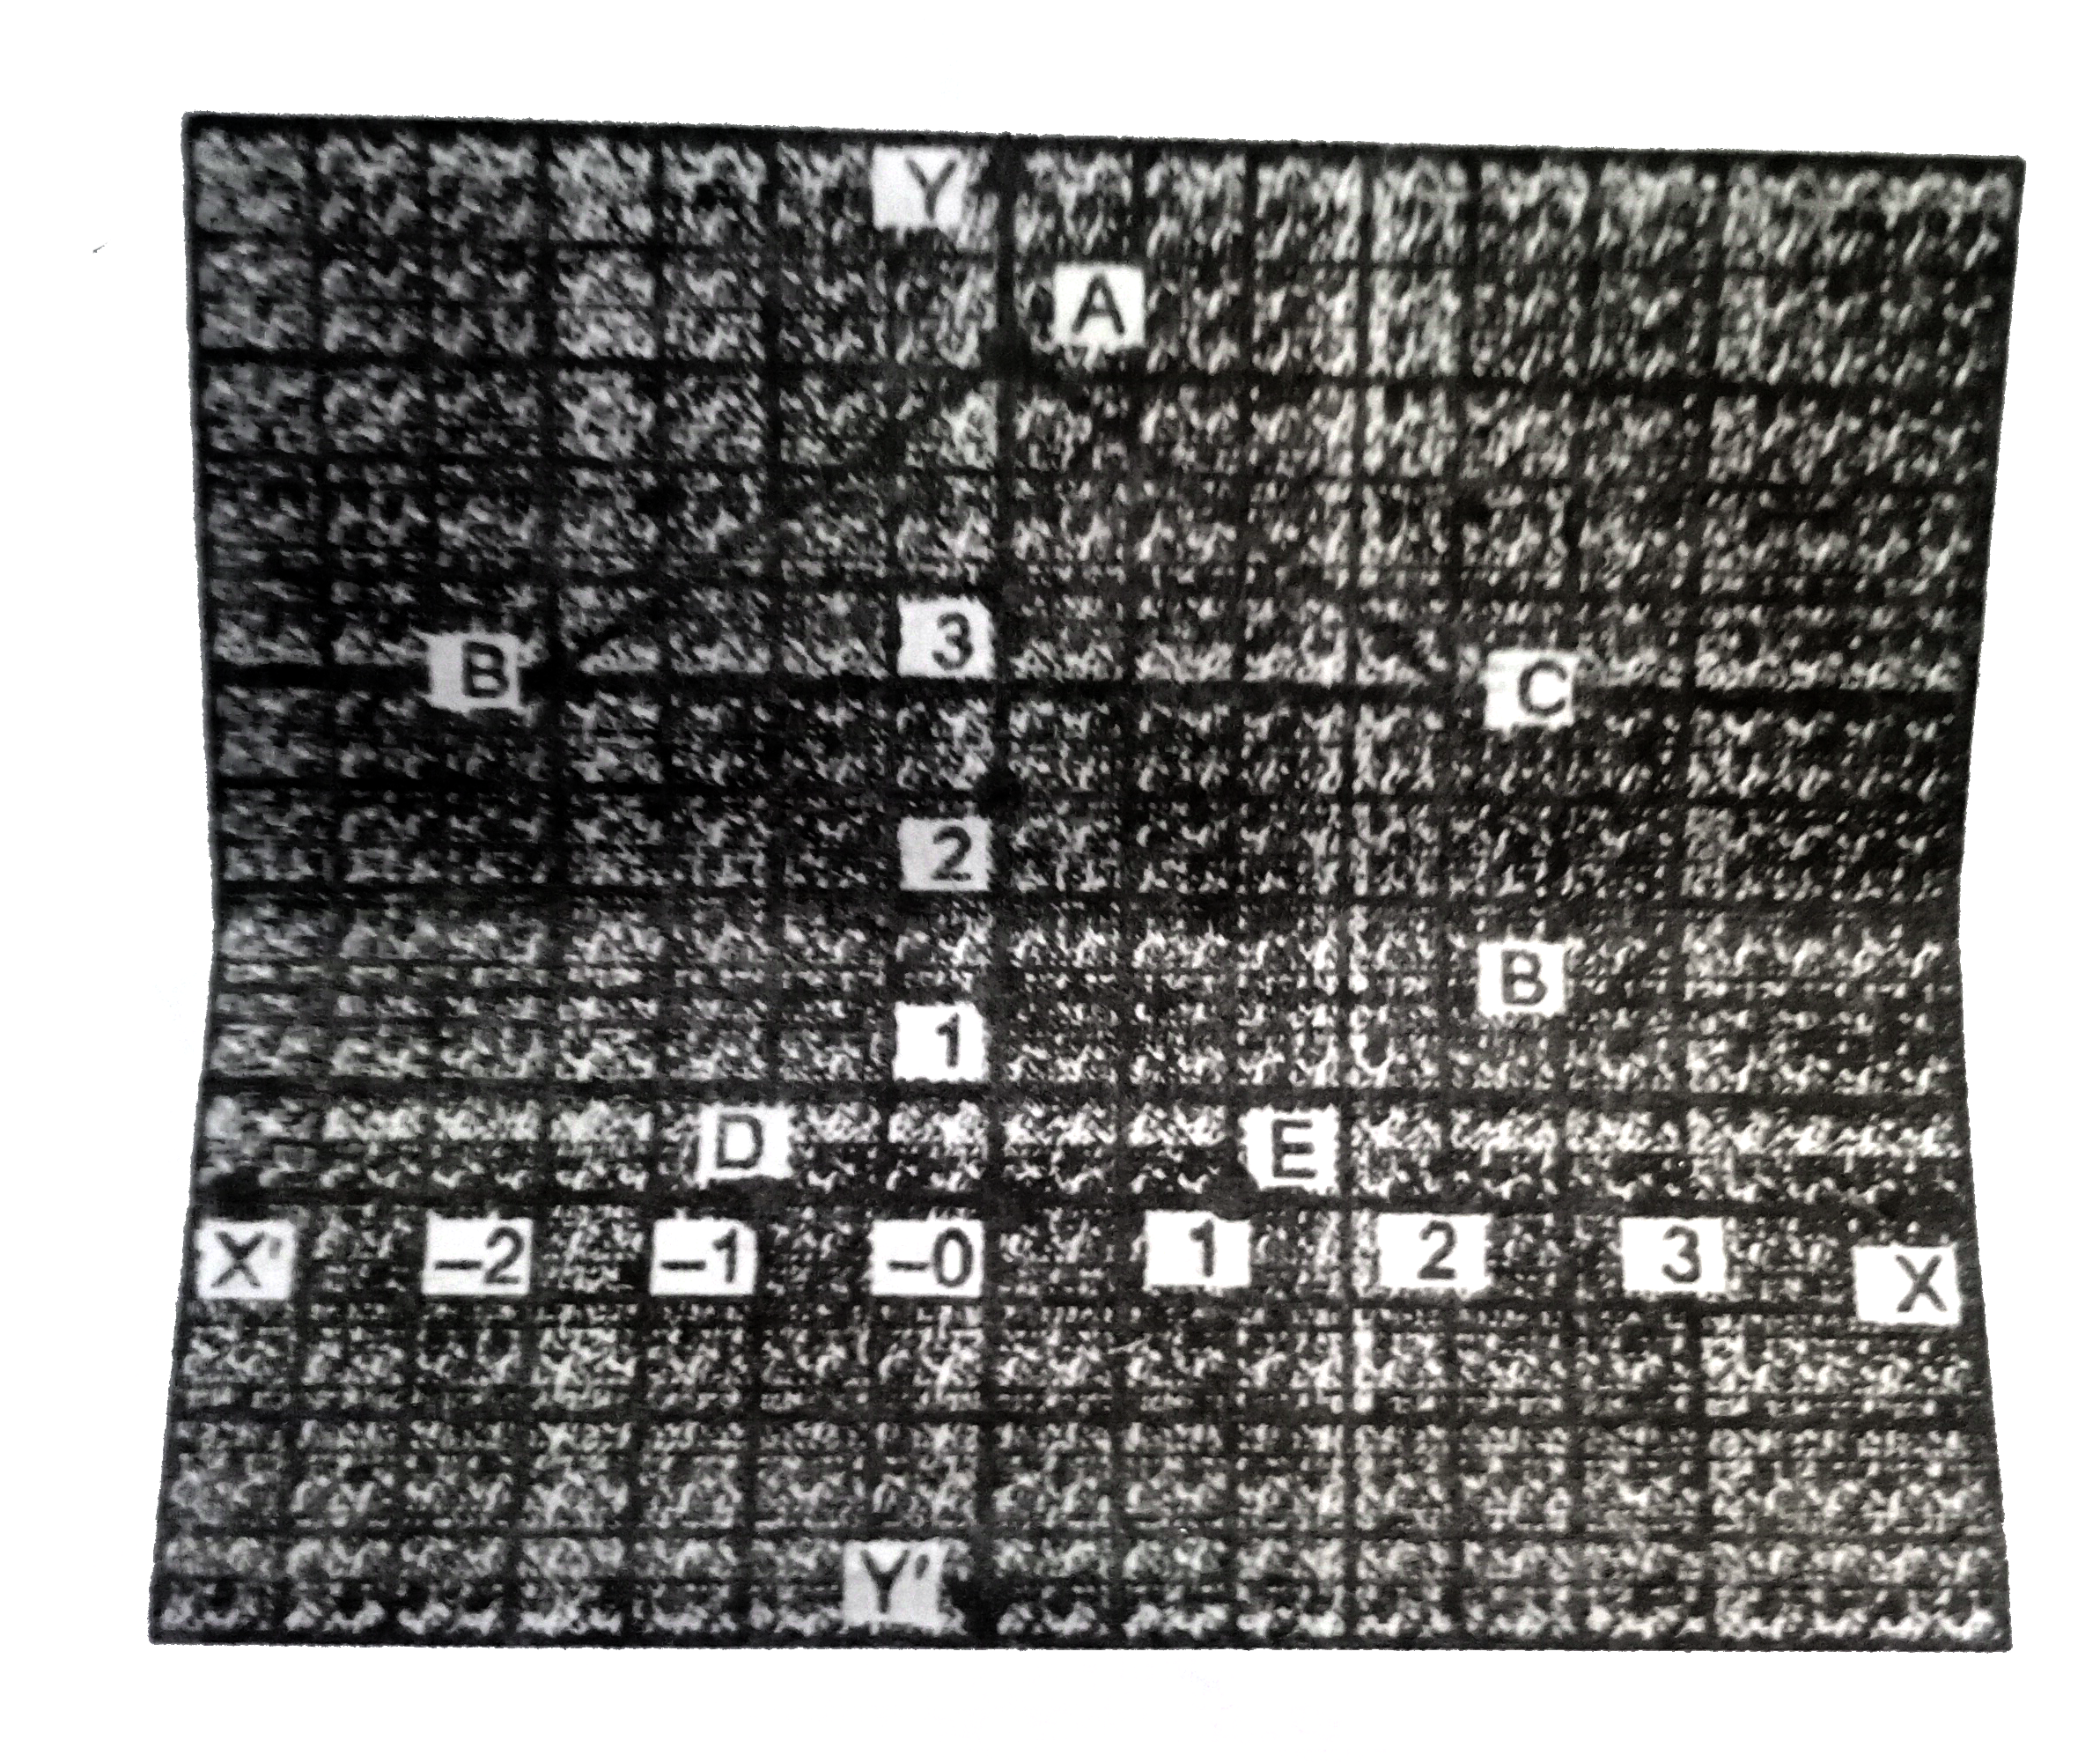
दिये गए चित्र से बिदुंओं A,B,C,E,F,G,H,I,J,K के निर्देशांक ज्ञात करें ।
(i) 
The correct Answer is:
Step by step video & image solution for दिये गए चित्र से बिदुंओं A,B,C,E,F,G,H,I,J,K के निर्देशांक ज्ञात करें । (i) by Maths experts to help you in doubts & scoring excellent marks in Class 9 exams.
Updated on:21/07/2023Topper's Solved these Questions
- निर्देशांक ज्यामिति BOOK - KIRAN PUBLICATIONCHAPTER - निर्देशांक ज्यामिति EXERCISE - EXERCISE-5.1 (चित्र में दी गई आकृति को देखकर निम्नलिखित कथनो को पूरा करे)।
4 Videos
- निर्देशांक ज्यामिति BOOK - KIRAN PUBLICATIONCHAPTER - निर्देशांक ज्यामिति EXERCISE - EXERCISE-5.1 (चित्र में दी गई आकृति को देखकर निम्नलिखित कथनो को पूरा करे)।
4 Videos
- दो चरों वाले रैखिक समीकरण BOOK - KIRAN PUBLICATIONCHAPTER - दो चरों वाले रैखिक समीकरण EXERCISE - EXERCISE-6.1
56 Videos
- पृष्ठीय क्षेत्रफल और आयतनBOOK - KIRAN PUBLICATIONCHAPTER - पृष्ठीय क्षेत्रफल और आयतनEXERCISE - EXERCISE - 15.1
40 Videos
Similar Questions

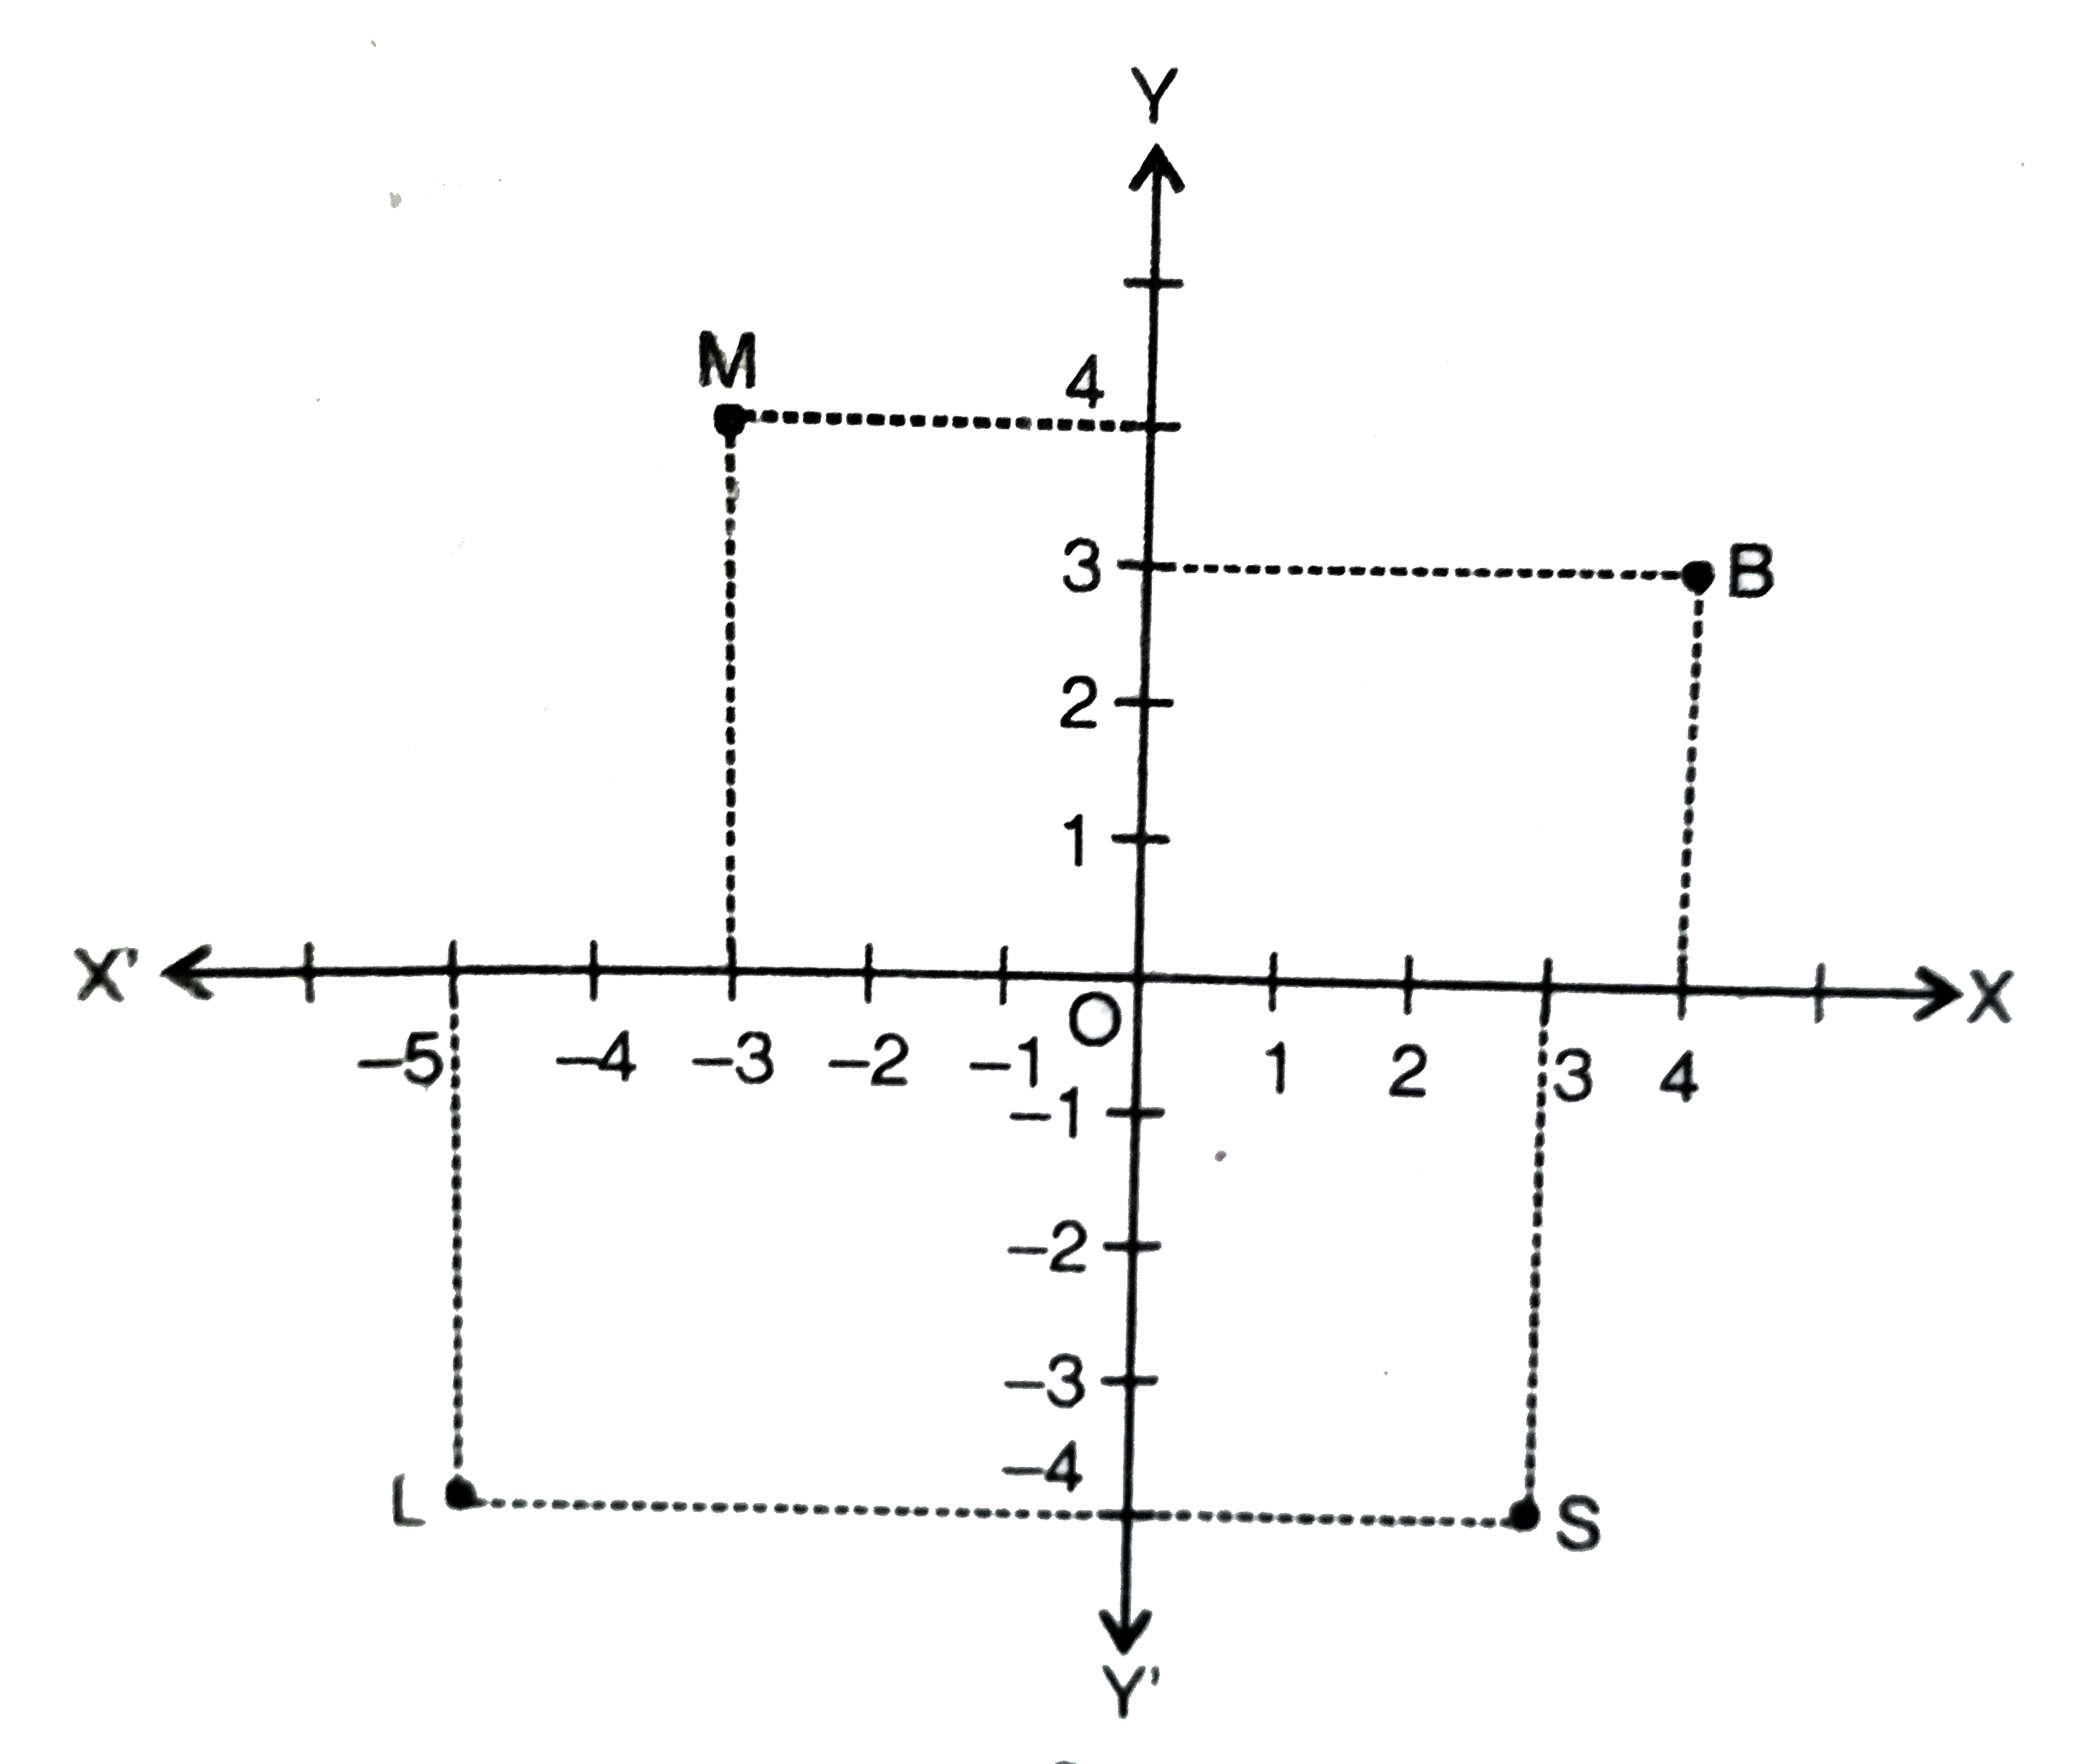
चित्र में दी गई आकृति को देखकर कथन को पूरा कीजिए ।
बिंदु B का भुज और कोटि क्रमशः ...... और ......... हैं । अतः B के निर्देशांक (........ , .........) हैं ।
View Solution
चित्र में दी गई आकृति को देखकर कथन को पूरा कीजिए ।
बिंदु B का भुज और कोटि क्रमशः ...... और ......... हैं । अतः B के निर्देशांक (........ , .........) हैं ।
View Solutionनीचे दिए गए समीकरणों को ax+by+c=30 के रूप में लिखिए और प्रत्येक स्थिति में a, b,cके मान बताइए।
2x+3y=4.37
View Solutionकिसी घन का किनारा दुगुना कर दिया जाए, तो आयतन कितना गुणा हो जायेगा?
View SolutionHow many lines of symmetry does the above figure have ?
View SolutionWhich of the following are correct chain isomers of butane ? (i)
View SolutionDetermine the point of symmetry of a regular hexagon.
View SolutionDtermine the images of the following figure about the given line :
View SolutionMatch the following Column A to Column B

View SolutionMatch the following Column A to Column B

View SolutionMatch the following Column A to Column B

View SolutionThe inequation represented by the graph given below is :
View SolutionThe inequation that best describes the graph given below is _________
View SolutionThe inequation that best describes the following graph is _________
View SolutionWhich inequations represent the shaded region in the given figure
View SolutionIn the chemical reactions,
ltimg src="https://d10lpgp6xz60nq.cloudfront.net/physics_images/JM_10_CHE_P1_E01_009_S01.png" width="80%"gt
the compounds 'A' and 'B' respectively are
View Solution
