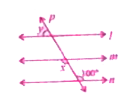
नीचे के चित्रों में कारण सहित समांतर रेखा युग्मों को लिखे।

The correct Answer is:अतः l||m||n
Step by step video & image solution for नीचे के चित्रों में कारण सहित समांतर रेखा युग्मों को लिखे। by Maths experts to help you in doubts & scoring excellent marks in Class 9 exams.
Updated on:21/07/2023Topper's Solved these Questions
- रेखाएँ और कोण BOOK - KIRAN PUBLICATIONCHAPTER - रेखाएँ और कोण EXERCISE - EXERCISE - 8.2 (रिक्त स्थानों को भरे -)
3 Videos
- रेखाएँ और कोण BOOK - KIRAN PUBLICATIONCHAPTER - रेखाएँ और कोण EXERCISE - EXERCISE - 8.3
69 Videos
- रेखाएँ और कोण BOOK - KIRAN PUBLICATIONCHAPTER - रेखाएँ और कोण EXERCISE - EXERCISE - 8.1 ( निम्नलिखित प्रश्नो के उत्तर दें। )
3 Videos
- यूक्लिड की ज्यामिति का परिचयBOOK - KIRAN PUBLICATIONCHAPTER - यूक्लिड की ज्यामिति का परिचयEXERCISE - EXERCISE 7.1
14 Videos
- लंबवृतीय बेलनBOOK - KIRAN PUBLICATIONCHAPTER - लंबवृतीय बेलनEXERCISE - EXERCISE-16
47 Videos
Similar Questions
किसी रेखाखंड पर खींचे गये सभी लम्ब आपस में . . . . . . . . होते है।
View Solutionकिसी त्रिभुज के तीनों कोणों का योग . . . . . . होता है।
View Solutionयदि एक किरण किसी रेखा पर आधारित हो तो बने आसन्न कोण का योग कितना होगा ?
View Solutionनिम्नलिखित कथनों में से कौन-सा कथन सत्य है ?
View Solutionरिक्त स्थानों की पूर्ति करें।
एक लम्बवृतीय बेलन की त्रिज्या 7cm और ऊँचाई 5 cm हो, तो उसके वक्र पृष्ठ का क्षेत्रफल.....होगा।
View SolutionHow many lines of symmetry does the above figure have ?
View SolutionWhich of the following are correct chain isomers of butane ? (i)
View SolutionDetermine the point of symmetry of a regular hexagon.
View SolutionDtermine the images of the following figure about the given line :
View SolutionMatch the following Column A to Column B

View SolutionMatch the following Column A to Column B

View SolutionMatch the following Column A to Column B

View SolutionFind the area of the figure given below.

View SolutionThe area of the shaded part in the figure given below is ______.

View SolutionThe inequation represented by the graph given below is :
View SolutionThe inequation that best describes the graph given below is _________
View Solution
