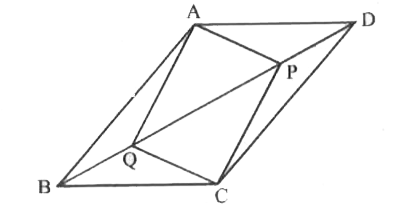
समांतर चतुर्भुज ABCD के विकर्ण BD पर दो बिन्दु Pऔर Q इस प्रकार स्थित हैं कि DP = BQ हैं ( देखिए आकृति)।दर्शाइए कि-
AP = CQ

Step by step video & image solution for समांतर चतुर्भुज ABCD के विकर्ण BD पर दो बिन्दु Pऔर Q इस प्रकार स्थित हैं कि DP = BQ हैं ( देखिए आकृति)।दर्शाइए कि- AP = CQ by Maths experts to help you in doubts & scoring excellent marks in Class 9 exams.
Topper's Solved these Questions
- BOOK - DEEPAK PUBLICATIONCHAPTER - चतुर्भुज EXERCISE - प्रश्नावली 8.211videos
चतुर्भुज
- BOOK - DEEPAK PUBLICATIONCHAPTER - चतुर्भुज EXERCISE - परीक्षोपयोगी अन्य महत्त्वपूर्ण प्रश्न10videos
चतुर्भुज
- BOOK - DEEPAK PUBLICATIONCHAPTER - QUESTION PAPPER (2018)EXERCISE - खण्ड - स14videos
QUESTION PAPPER (2018)
- BOOK - DEEPAK PUBLICATIONCHAPTER - त्रिभुजEXERCISE - अध्याय का तीव्र अध्ययन41videos
त्रिभुज
Similar Questions
ABCD एक चतुर्भुज है। जिसमें P, Q, R और S क्रमशः भुजाओं AB, BC, CD और DA के मध्य बिन्दु है। AC उसका एक विकर्ण है दर्शाइए कि:
(i)SR∣∣AC और SR=12AC
(ii) PQ = RS
(iii) PQRS एक समान्तर चतुर्भुज है।01:37View Solutionचतुर्भुज के चारों कोणों का योग होता है :
06:07View Solution17+3√2 के हर का परिमेय करण कीजिए।
02:11View Solutionआकृति में, OA = OB और OD = OC है, तो ΔAOD≅ΔBOC किस नियम पर आधारित है ?
 01:31View Solution
How many lines of symmetry does the above figure have ?
02:45View SolutionWhich of the following are correct chain isomers of butane ? (i)
02:17View SolutionDetermine the point of symmetry of a regular hexagon.
05:41View SolutionDtermine the images of the following figure about the given line :
02:21View SolutionMatch the following Column A to Column B
 02:03View Solution
Match the following Column A to Column B
 02:10View Solution
Match the following Column A to Column B
 02:17View Solution
Find the area of the figure given below.
 02:10View Solution
The area of the shaded part in the figure given below is ______.
 04:23View Solution
The inequation represented by the graph given below is :
01:13View SolutionThe inequation that best describes the graph given below is _________
03:12View SolutionThe inequation that best describes the following graph is _________
05:46View Solution

