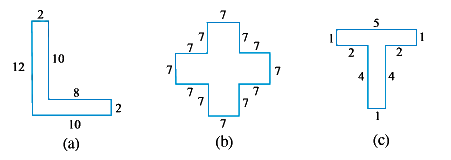
आकृतियों को आयतनों में तोड़िये और प्रत्येक का क्षेत्रफल ज्ञात कीजिय । ( भुजाओ की माप सेमी में दी गई है )।

The correct Answer is:(a) 40 वर्ग सेमी
(b) 245 वर्ग सेमी
(c ) 9 वर्ग सेमी
Step by step video, text & image solution for आकृतियों को आयतनों में तोड़िये और प्रत्येक का क्षेत्रफल ज्ञात कीजिय । ( भुजाओ की माप सेमी में दी गई है )। by Maths experts to help you in doubts & scoring excellent marks in Class 6 exams.
Topper's Solved these Questions
- BOOK - MBD PUBLICATIONCHAPTER - क्षेत्रमिति EXERCISE - प्रश्नावली 10.3 (अभ्यास के लिए अतिरिक्त प्रश्न)7videos
क्षेत्रमिति
- BOOK - MBD PUBLICATIONCHAPTER - क्षेत्रमिति EXERCISE - वस्तुनिष्ट प्रश्न21videos
क्षेत्रमिति
- BOOK - MBD PUBLICATIONCHAPTER - क्षेत्रमिति EXERCISE - प्रश्नावली 10.2 (अभ्यास के लिए अतिरिक्त प्रश्न)3videos
क्षेत्रमिति
- BOOK - MBD PUBLICATIONCHAPTER - आधारभूत ज्यामितीय अवधारणाएँ EXERCISE - वस्तुनिष्ठ प्रश्न (नीचे प्रत्येक प्रश्न चार - चार उत्तर दिए है। सही उत्तर का चयन करें।)28videos
आधारभूत ज्यामितीय अवधारणाएँ
- BOOK - MBD PUBLICATIONCHAPTER - दशमलव EXERCISE - प्रयास कीजिये16videos
दशमलव
Similar Questions
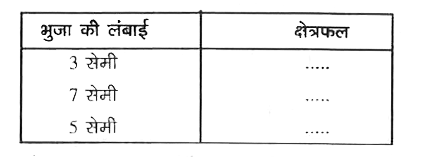
कुछ वर्गों की एक भुजा की लंबाई दी गई है। उनका क्षेत्रफल ज्ञात कीजिए।
 01:37View Solution
एक बंद आकृति के रेखाखंडों के साथ-साथ चलते हुए, जब आप उस आकृति के चारों ओर एक पूरा चक्कर लगाते हैं तो इस प्रकार चली दूरी कहलाती है :
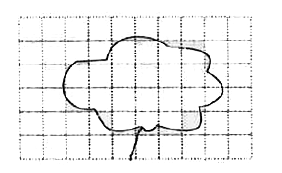
06:07View Solutionवर्गों को गिनकर आकृति का अनुमानित क्षेत्रफल ज्ञात कीजिए :
 02:11View Solution
एक रेखा के :
01:31View Solution32,45,85 को दशमलव रूप में लिखिए
02:45View SolutionHow many lines of symmetry does the above figure have ?
02:17View SolutionWhich of the following are correct chain isomers of butane ? (i)
05:41View SolutionDetermine the point of symmetry of a regular hexagon.
02:21View SolutionDtermine the images of the following figure about the given line :
02:03View SolutionMatch the following Column A to Column B
 02:10View Solution
Match the following Column A to Column B
 02:17View Solution
Match the following Column A to Column B
 02:10View Solution
Find the area of the figure given below.
 04:23View Solution
The area of the shaded part in the figure given below is ______.
 01:13View Solution
The inequation represented by the graph given below is :
03:12View SolutionThe inequation that best describes the graph given below is _________
05:46View Solution

