यदि x, y के साथ प्रतिलोम विचरण करता है, तो

Step by step video & image solution for यदि x, y के साथ प्रतिलोम विचरण करता है, तो by Maths experts to help you in doubts & scoring excellent marks in Class 8 exams.
Updated on:21/07/2023Topper's Solved these Questions
- अनुलोम और प्रतिलोम समानुपातBOOK - NCERT EXEMPLAR HINDICHAPTER - अनुलोम और प्रतिलोम समानुपातEXERCISE - प्रश्नावली (सत्य (T) हैं या असत्य)
22 Videos
- अनुलोम और प्रतिलोम समानुपातBOOK - NCERT EXEMPLAR HINDICHAPTER - अनुलोम और प्रतिलोम समानुपातEXERCISE - अनुप्रयोग, खेल और पहेलियाँ (D)
4 Videos
- अनुलोम और प्रतिलोम समानुपातBOOK - NCERT EXEMPLAR HINDICHAPTER - अनुलोम और प्रतिलोम समानुपातEXERCISE - अनुप्रयोग, खेल और पहेलियाँ (D)
4 Videos
- आँकड़ो का प्रबंधन BOOK - NCERT EXEMPLAR HINDICHAPTER - आँकड़ो का प्रबंधन EXERCISE - अनुप्रयोग,खेल और पहेलीयाँ
1 Videos
Similar Questions
दो x और y राशियाँ परस्पर सीधे विचरित कही जाती हैं, यदि किसी परिमेय संख्या k के लिए xy= k हो।
View Solutionचाल =चली गई दूरी/ लिया गया समय
अपनी कक्षा के न्यूनतम 10 विद्यार्थियों को कुछ दूरी चलने को कहकर, उनकी चालें परिकलित कीजिए। प्रत्येक विद्यार्थी द्वारा चली गई दूरी और उसके लिये लिया गया समय रिकॉर्ड कीजिए। इसके बाद निम्न सारणी को पूरा कीजिए-

कौन-सा विद्यार्थी सबसे तेज दौड़ा?
View Solutionचाल =चली गई दूरी/ लिया गया समय
अपनी कक्षा के न्यूनतम 10 विद्यार्थियों को कुछ दूरी चलने को कहकर, उनकी चालें परिकलित कीजिए। प्रत्येक विद्यार्थी द्वारा चली गई दूरी और उसके लिये लिया गया समय रिकॉर्ड कीजिए। इसके बाद निम्न सारणी को पूरा कीजिए-

कौन-सा विद्यार्थी सबसे तेज दौड़ा?
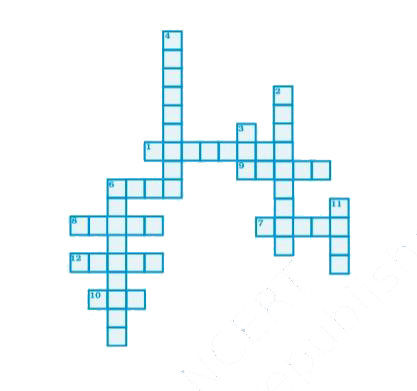
View Solutionक्रॉसवर्ड पहेली
दिए हुए क्रॉसवर्ड को हल कीजिए और फिर दिए हुए खानों को अंग्रेजी के अक्षरों द्वारा भरिए। एक्रॉस और डाउन दोनों को भरने के लिए संकेत नीचे दिए गए हैं। साथ ही, एक्रॉस और डाउन से संबंधित संख्याएँ खानों के कोनों पर लिखी हुई हैं। संकेतों के उत्तर संगत खानों में भरिये।
संकेत
एक्रॉस
1. Another name for a circle graph is ____________
1. वृत्त आलेख के लिए एक अन्य नाम ____________ है।
6. Class width of the interval 10-15 is ____________
6. अंतराल 10-15 की वर्ग चौड़ाई ____________ है।
7. Difference of highest and lowest observations in a given data is called ____________
7. आँकड़ों में सबसे बड़े और सबसे छोटे प्रेक्षणों का अंतर ____________ कहलाता है।
8. Each outcome or a collection of outcomes in an experiment is known As____________
8. किसी प्रयोग में प्रत्येक परिणाम या परिणामों का संग्रह एक ____________ कहलाता है।
9. Pie chart represents the comparison of parts to a ____________
9. पाई चार्ट एक ____________की भागों से तुलना निरूपित करता है। ____________ 10. Probability of sun rising from the east is ____________
10. सूर्य की पूर्व से उदय होने की प्रायिकता ____________है।
12. Probability of getting a head or a tail on tossing a coin once is____________
12. एक सिक्के को एक बार उछालने पर चित या पट प्राप्त करने की प्रायिकता ____________ है।
डाउन
2. Representation of grouped data graphically is called ____________
2. वर्गीकृत आँकड़ों का आलेखीय निरूपण____________ कहलाता है।
3. Unorganised, ungrouped data is called ____________
3. असंगठित अवर्गीकृत आँकड़े ____________ कहलाते हैं।
4. Difference between upper and lower class limits. is known as____________
4. उपरि और निम्न वर्ग सीमाओं का अंतर ____________ कहलाता है।
6. The number of times a particular observation occures in the given data is called ____________
6. दिए हुए आँकड़ों में एक विशेष प्रेक्षण जितनी बार आता है वह उसकी ____________ कहलाती है।
11. Is today is Saturday, then the probability of two days after tomorrow being a Monday is ____________
11. यदि आज शनिवार है, तो कल के दो दिन बाद सोमवार होने की प्रायिकता____________

View SolutionHow many lines of symmetry does the above figure have ?
View SolutionWhich of the following are correct chain isomers of butane ? (i)
View SolutionDetermine the point of symmetry of a regular hexagon.
View SolutionDtermine the images of the following figure about the given line :
View SolutionMatch the following Column A to Column B

View SolutionMatch the following Column A to Column B

View SolutionMatch the following Column A to Column B

View SolutionFind the area of the figure given below.

View SolutionThe inequation represented by the graph given below is :
View SolutionThe inequation that best describes the graph given below is _________
View SolutionThe inequation that best describes the following graph is _________
View SolutionWhich inequations represent the shaded region in the given figure
View Solution
