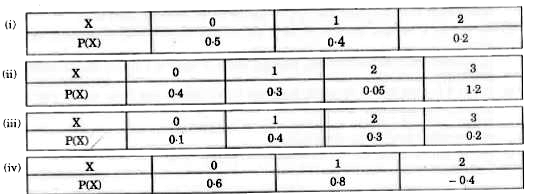
यादृच्छिक चर X के निम्नांकित प्रायिकता वितरण फलन है:

तो P(x<6) ज्ञात कीजिए।
The correct Answer is:0.81
Step by step video, text & image solution for यादृच्छिक चर X के निम्नांकित प्रायिकता वितरण फलन है: तो P(x lt 6) ज्ञात कीजिए। by Maths experts to help you in doubts & scoring excellent marks in Class 12 exams.
Updated on:21/07/2023Topper's Solved these Questions
- यादृच्छिक चर तथा प्रायिकता बंटनBOOK - SBPD PUBLICATIONCHAPTER - यादृच्छिक चर तथा प्रायिकता बंटनEXERCISE - अभ्यास 15.1 (वस्तुनिष्ठ प्रश्न)
4 Videos
- यादृच्छिक चर तथा प्रायिकता बंटनBOOK - SBPD PUBLICATIONCHAPTER - यादृच्छिक चर तथा प्रायिकता बंटनEXERCISE - अभ्यास 15.1 (लघु उत्तरीय प्रश्न)
6 Videos
- बर्नोली परीक्षण और द्विपद बंटन BOOK - SBPD PUBLICATIONCHAPTER - बर्नोली परीक्षण और द्विपद बंटन EXERCISE - कम्पीटीशन कॉर्नर
1 Videos
- रैखिक प्रोग्रामन BOOK - SBPD PUBLICATIONCHAPTER - रैखिक प्रोग्रामन EXERCISE - कम्प्टीशन कॉर्नर
4 Videos
Similar Questions
एक यादृच्छिक चर X का प्रायिकता बंटन निम्नवत् है, तब a का मान है :

View Solutionज्ञात कीजिए निम्नांकित में से कौन-सा यादृच्छिक चर का प्रायिकता बंटन नहीं है। अपने उत्तर का कारण स्पष्ट कीजिए :

View Solutionएक व्यक्ति X के 7 मित्र हैं, जिनमें 4 महिलाएँ हैं तथा 3 पुरुष हैं, उसकी पत्नी Y के भी 7 मित्र हैं जिनमें 3 महिलाएँ तथा 4 पुरुष हैं। यह माना गया है कि X तथा Y का कोई उभयनिष्ठ मित्र नहीं है तो उन तरीकों की संख्या जिनमें X तथा Y एक साथ 3 महिलाओं तथा 3 पुरुषों को पार्टी पर बुलाएँ कि X तथा Y प्रत्येक के तीन-तीन मित्र आये हैं
View Solutionx1+x2≤1,−3x1+x2≥3,(x1,x2≥0) द्वारा निरूपित सुसंगत क्षेत्र है
View SolutionHow many lines of symmetry does the above figure have ?
View SolutionWhich of the following are correct chain isomers of butane ? (i)
View SolutionDetermine the point of symmetry of a regular hexagon.
View SolutionDtermine the images of the following figure about the given line :
View SolutionMatch the following Column A to Column B

View SolutionMatch the following Column A to Column B

View SolutionMatch the following Column A to Column B

View SolutionThe inequation represented by the graph given below is :
View SolutionThe inequation that best describes the graph given below is _________
View SolutionThe inequation that best describes the following graph is _________
View SolutionWhich inequations represent the shaded region in the given figure
View SolutionIn Fig, find the value of x.
ltimg src="https://d10lpgp6xz60nq.cloudfront.net/physics_images/PS_MATH_IX_C12_S01_032_Q01.png" width="80%"gt
View Solution
