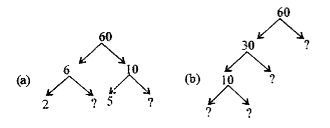
यहाँ 60 के लिए दो भिन्न-भिन्न गुणनखण्ड वृक्ष दिए गए हैं। इनमे अज्ञात संख्याएँ लिखिए।

The correct Answer is:(a) 3, 2 (b) 2, 3, 2, 5 या 2, 3, 5, 2
Step by step video, text & image solution for यहाँ 60 के लिए दो भिन्न-भिन्न गुणनखण्ड वृक्ष दिए गए हैं। इनमे अज्ञात संख्याएँ लिखिए। by Maths experts to help you in doubts & scoring excellent marks in Class 6 exams.
Updated on:21/07/2023Topper's Solved these Questions
- संख्याओं के साथ खेलना BOOK - STUDENTS FRIENDSCHAPTER - संख्याओं के साथ खेलना EXERCISE - EXERCISE 3(F)
17 Videos
- संख्याओं के साथ खेलना BOOK - STUDENTS FRIENDSCHAPTER - संख्याओं के साथ खेलना EXERCISE - EXERCISE 3(G)
11 Videos
- संख्याओं के साथ खेलना BOOK - STUDENTS FRIENDSCHAPTER - संख्याओं के साथ खेलना EXERCISE - EXERCISE 3(D)
4 Videos
- भिन्न BOOK - STUDENTS FRIENDSCHAPTER - भिन्न EXERCISE - वस्तुनिष्ठ प्रश्न
20 Videos
- सममितिBOOK - STUDENTS FRIENDSCHAPTER - सममितिEXERCISE - EXERCISE 13 (B)
9 Videos
Similar Questions
अभाज्य गुणनखंडन की विधि से निम्नलिखित का मo सo ज्ञात करें।
36, 60
View Solutionनिम्नांकित संख्याओं का ल. स. अभाज्य गुणनखण्डन की विधि से ज्ञात कीजिए :-
12,48,60
View Solutionनिम्नांकित के सार्व-गुणनखण्ड ज्ञात कीजिए।
(a) 4, 18 (b) 4, 12, 16 (c) 75, 60, 210 (d) 56, 120
View Solutionनिम्नांकित में उचित भिन्न कौन है ?
View Solutionनिम्नांकित आकारों में से प्रत्येक के लिए सममिति रेखाओं की संख्या बताइये।

View SolutionHow many lines of symmetry does the above figure have ?
View SolutionWhich of the following are correct chain isomers of butane ? (i)
View SolutionDetermine the point of symmetry of a regular hexagon.
View SolutionDtermine the images of the following figure about the given line :
View SolutionMatch the following Column A to Column B

View SolutionMatch the following Column A to Column B

View SolutionMatch the following Column A to Column B

View SolutionFind the area of the figure given below.

View SolutionThe area of the shaded part in the figure given below is ______.

View SolutionThe inequation represented by the graph given below is :
View SolutionThe inequation that best describes the graph given below is _________
View Solution
