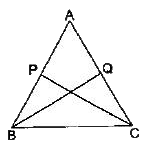
आकृति में, AB = AC तथा AP = AQ है। सर्वांगसमता के किस प्रतिबंध के अधीन ΔPBC≅ΔQCB है?

SSS
ASA
SAS
RHS
The correct Answer is:C
Step by step video solution for आकृति में, AB = AC तथा AP = AQ है। सर्वांगसमता के किस प्रतिबंध के अधीन DeltaPBC~=DeltaQCB है? by Maths experts to help you in doubts & scoring excellent marks in Class 9 exams.
Updated on:21/07/2023Topper's Solved these Questions
- त्रिभुजों की सर्वांगसमता एवं असमिकाएँ BOOK - BHARATI BHAWANCHAPTER - त्रिभुजों की सर्वांगसमता एवं असमिकाएँ EXERCISE - प्रश्नमाला 9B
10 Videos
- त्रिभुज BOOK - BHARATI BHAWANCHAPTER - त्रिभुज EXERCISE - प्रश्नमाला 8B (बहुवैकल्पिक प्रश्न)
14 Videos
- दो चरों वाले रैखिक समीकरणBOOK - BHARATI BHAWANCHAPTER - दो चरों वाले रैखिक समीकरणEXERCISE - प्रश्नमाला 4D
7 Videos
Similar Questions
बताइए कि नीचे दी गई भुजाओं से त्रिभुज की रचना संभव है अथवा नहीं। अपने उत्तर के लिए उपयुक्त कारण दीजिए। -
5 cm, 4 cm,9cm
View Solutionयदि एक त्रिभुज का एक कोण 75∘ है तथा शेष दो कोणों का अंतर 35 है, तो त्रिभुज का सबसे बड़ा कोण होगा। -
View Solutionएक पेन की कीमत ₹५ है और एक पेंसिल की कीमत ₹ है। एक लड़की 2 पेन और 3 पेंसिल की कीमत ₹16 चुकाती है। इन आँकड़ों को संतुष्ट करनेवाला रैखिक समीकरण है|
View SolutionHow many lines of symmetry does the above figure have ?
View SolutionWhich of the following are correct chain isomers of butane ? (i)
View SolutionDetermine the point of symmetry of a regular hexagon.
View SolutionDtermine the images of the following figure about the given line :
View SolutionIn the figure above (not to scale), ¯¯¯¯¯¯AB⊥¯¯¯¯¯¯CDandAD is the bisector of ∠BAE.AB=3cm and AC=5cm. Find CD.
View SolutionMatch the following Column A to Column B

View SolutionMatch the following Column A to Column B

View SolutionMatch the following Column A to Column B

View SolutionFind the area of the figure given below.

View SolutionThe area of the shaded part in the figure given below is ______.

View SolutionThe inequation represented by the graph given below is :
View SolutionThe inequation that best describes the graph given below is _________
View SolutionThe inequation that best describes the following graph is _________
View Solution
