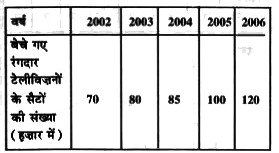
निम्नलिखित आंकड़े 5 वर्ष के लिए रंगदार टेलीविजन साइटों की बिक्री की सुचना प्रदान करते है

उपरोक्त आंकड़ों को निरूपित करने के लिए उपयुक्त आलेख खींचिए।
The correct Answer is:(##MBDHINMATVIIIC15SLV018_A01##)
Topper's Solved these Questions
- आलेखों से परिचय BOOK - MBD PUBLICATIONCHAPTER - आलेखों से परिचय EXERCISE - अतिरिक्त उदाहरण (सत्य असत्य )
3 Videos
- आलेखों से परिचय BOOK - MBD PUBLICATIONCHAPTER - आलेखों से परिचय EXERCISE - पाठ्य-पुस्तक प्रश्नावली 15.1
29 Videos
- आकड़ों का प्रबंधन BOOK - MBD PUBLICATIONCHAPTER - आकड़ों का प्रबंधन EXERCISE - बहुविकल्पी प्रश्न
13 Videos
- एक चार वाले रैखिक समीकरण BOOK - MBD PUBLICATIONCHAPTER - एक चार वाले रैखिक समीकरण EXERCISE - बहुविकल्पी प्रश्न
15 Videos
Similar Questions
एक बिंदु जिसका x-निर्देशांक शून्य है, y- अक्ष पर स्थित होगा।
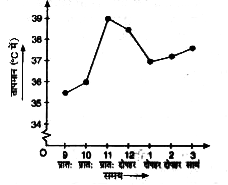
View Solutionनिम्न आलेख किसी अस्पताल में एक रोगी का प्रति घंटे लिया गया तापमान दर्शाता है

रोगी का तापमान 1 बजे दोपहर क्या था ?
View Solutionसंकेतों का प्रयोग करते हुए आकड़ों के चित्रीय निरूपण को कहते हैं :
View Solutionसमीकरण x−2=7 में x का मान है :
View SolutionHow many lines of symmetry does the above figure have ?
View SolutionWhich of the following are correct chain isomers of butane ? (i)
View SolutionDetermine the point of symmetry of a regular hexagon.
View SolutionDtermine the images of the following figure about the given line :
View SolutionMatch the following Column A to Column B

View SolutionMatch the following Column A to Column B

View SolutionMatch the following Column A to Column B

View SolutionFind the area of the figure given below.

View SolutionThe area of the shaded part in the figure given below is ______.

View SolutionThe inequation represented by the graph given below is :
View SolutionThe inequation that best describes the graph given below is _________
View SolutionThe inequation that best describes the following graph is _________
View Solution
