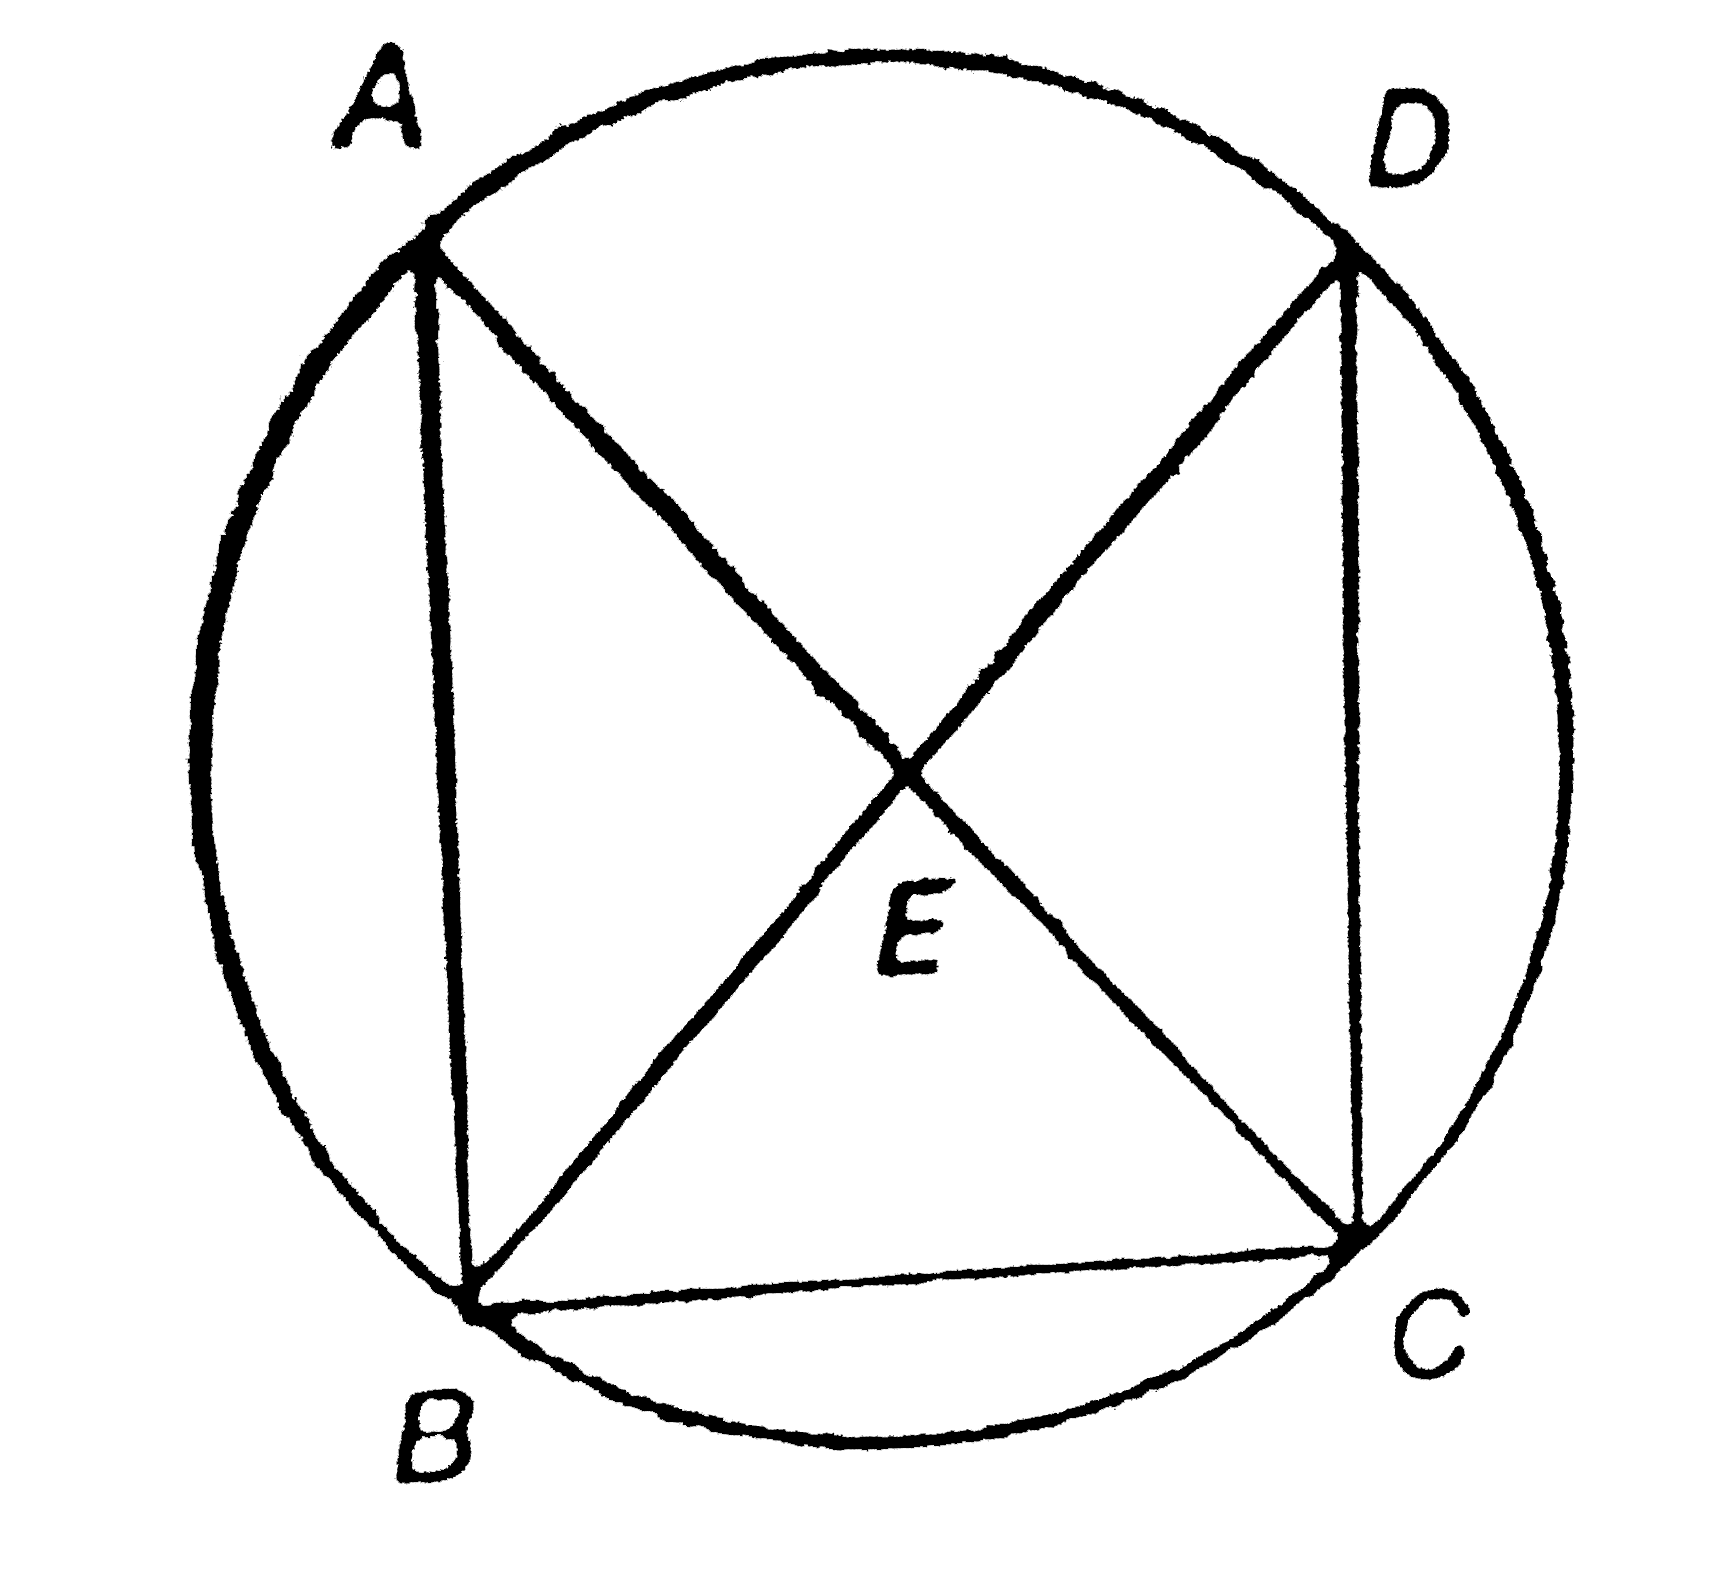
संलग्न चित्र में, O केन्द्र के वृत्त की एक जीवा DE, व्यास AC के समान्तर है | यदि ∠CBD=60∘, तो ∠CDE का मान ज्ञात कीजिए |

The correct Answer is:30∘
Step by step video & image solution for संलग्न चित्र में, O केन्द्र के वृत्त की एक जीवा DE, व्यास AC के समान्तर है | यदि angleCBD=60^(@), तो angleCDE का मान ज्ञात कीजिए | by Maths experts to help you in doubts & scoring excellent marks in Class 9 exams.
Topper's Solved these Questions
- BOOK - NOOTAN HINDICHAPTER - वृत्त EXERCISE - विविध प्रश्नावली (दीर्ध उत्तरीय प्रश्न)5videos
वृत्त
- BOOK - NOOTAN HINDICHAPTER - वृत्त EXERCISE - विविध प्रश्नावली (अतिलघु उत्तरीय प्रश्न)10videos
वृत्त
- BOOK - NOOTAN HINDICHAPTER - रेखाएं और कोण EXERCISE - दीर्घ उत्तरीय प्रशन5videos
रेखाएं और कोण
- BOOK - NOOTAN HINDICHAPTER - संख्या पद्धतिEXERCISE - विविध प्रश्नावली (लघु उत्तरीय प्रश्न)10videos
संख्या पद्धति
Similar Questions
एक वृत्त की दो जीवायें AB और CD केन्द्र के एक ही ओर इस प्रकार हैं कि AB = 6 सेमी, CD = 12 सेमी और AB∣∣CD हैं | यदि AB और CD के मध्य दूरी 3 सेमी है, तो वृत्त की त्रिज्या ज्ञात कीजिए |
01:37View Solutionयदि r त्रिज्या के वृत्त का केन्द्र O है तथा O से r/2 दुरी पर जीवा AB है तो ∠BAO ज्ञात कीजिए |
06:07View SolutionΔABC की भुजा BC को D तक बढ़ाया जाता है ∠A का समद्विभाजक BC को L पर मिलता है ।
सिद्ध कीजिये कि ∠ABC+∠ACD=2∠ALC02:11View Solution−14 और 25 के मध्य दो परिमेय संख्याएँ ज्ञात कीजिए ।
01:31View SolutionHow many lines of symmetry does the above figure have ?
02:45View SolutionWhich of the following are correct chain isomers of butane ? (i)
02:17View SolutionDetermine the point of symmetry of a regular hexagon.
05:41View SolutionDtermine the images of the following figure about the given line :
02:10View SolutionMatch the following Column A to Column B
 02:17View Solution
Match the following Column A to Column B
 02:10View Solution
Match the following Column A to Column B
 04:23View Solution
The inequation represented by the graph given below is :
01:58View SolutionThe inequation that best describes the graph given below is _________
02:01View SolutionThe inequation that best describes the following graph is _________
03:00View SolutionWhich inequations represent the shaded region in the given figure
03:00View SolutionIn the following figure (not to scale), the chords AC and BD intersects at E and ∠BAE=∠ECD+20∘. If ∠CDE=60∘, find ∠ABE.
 03:00View Solution

