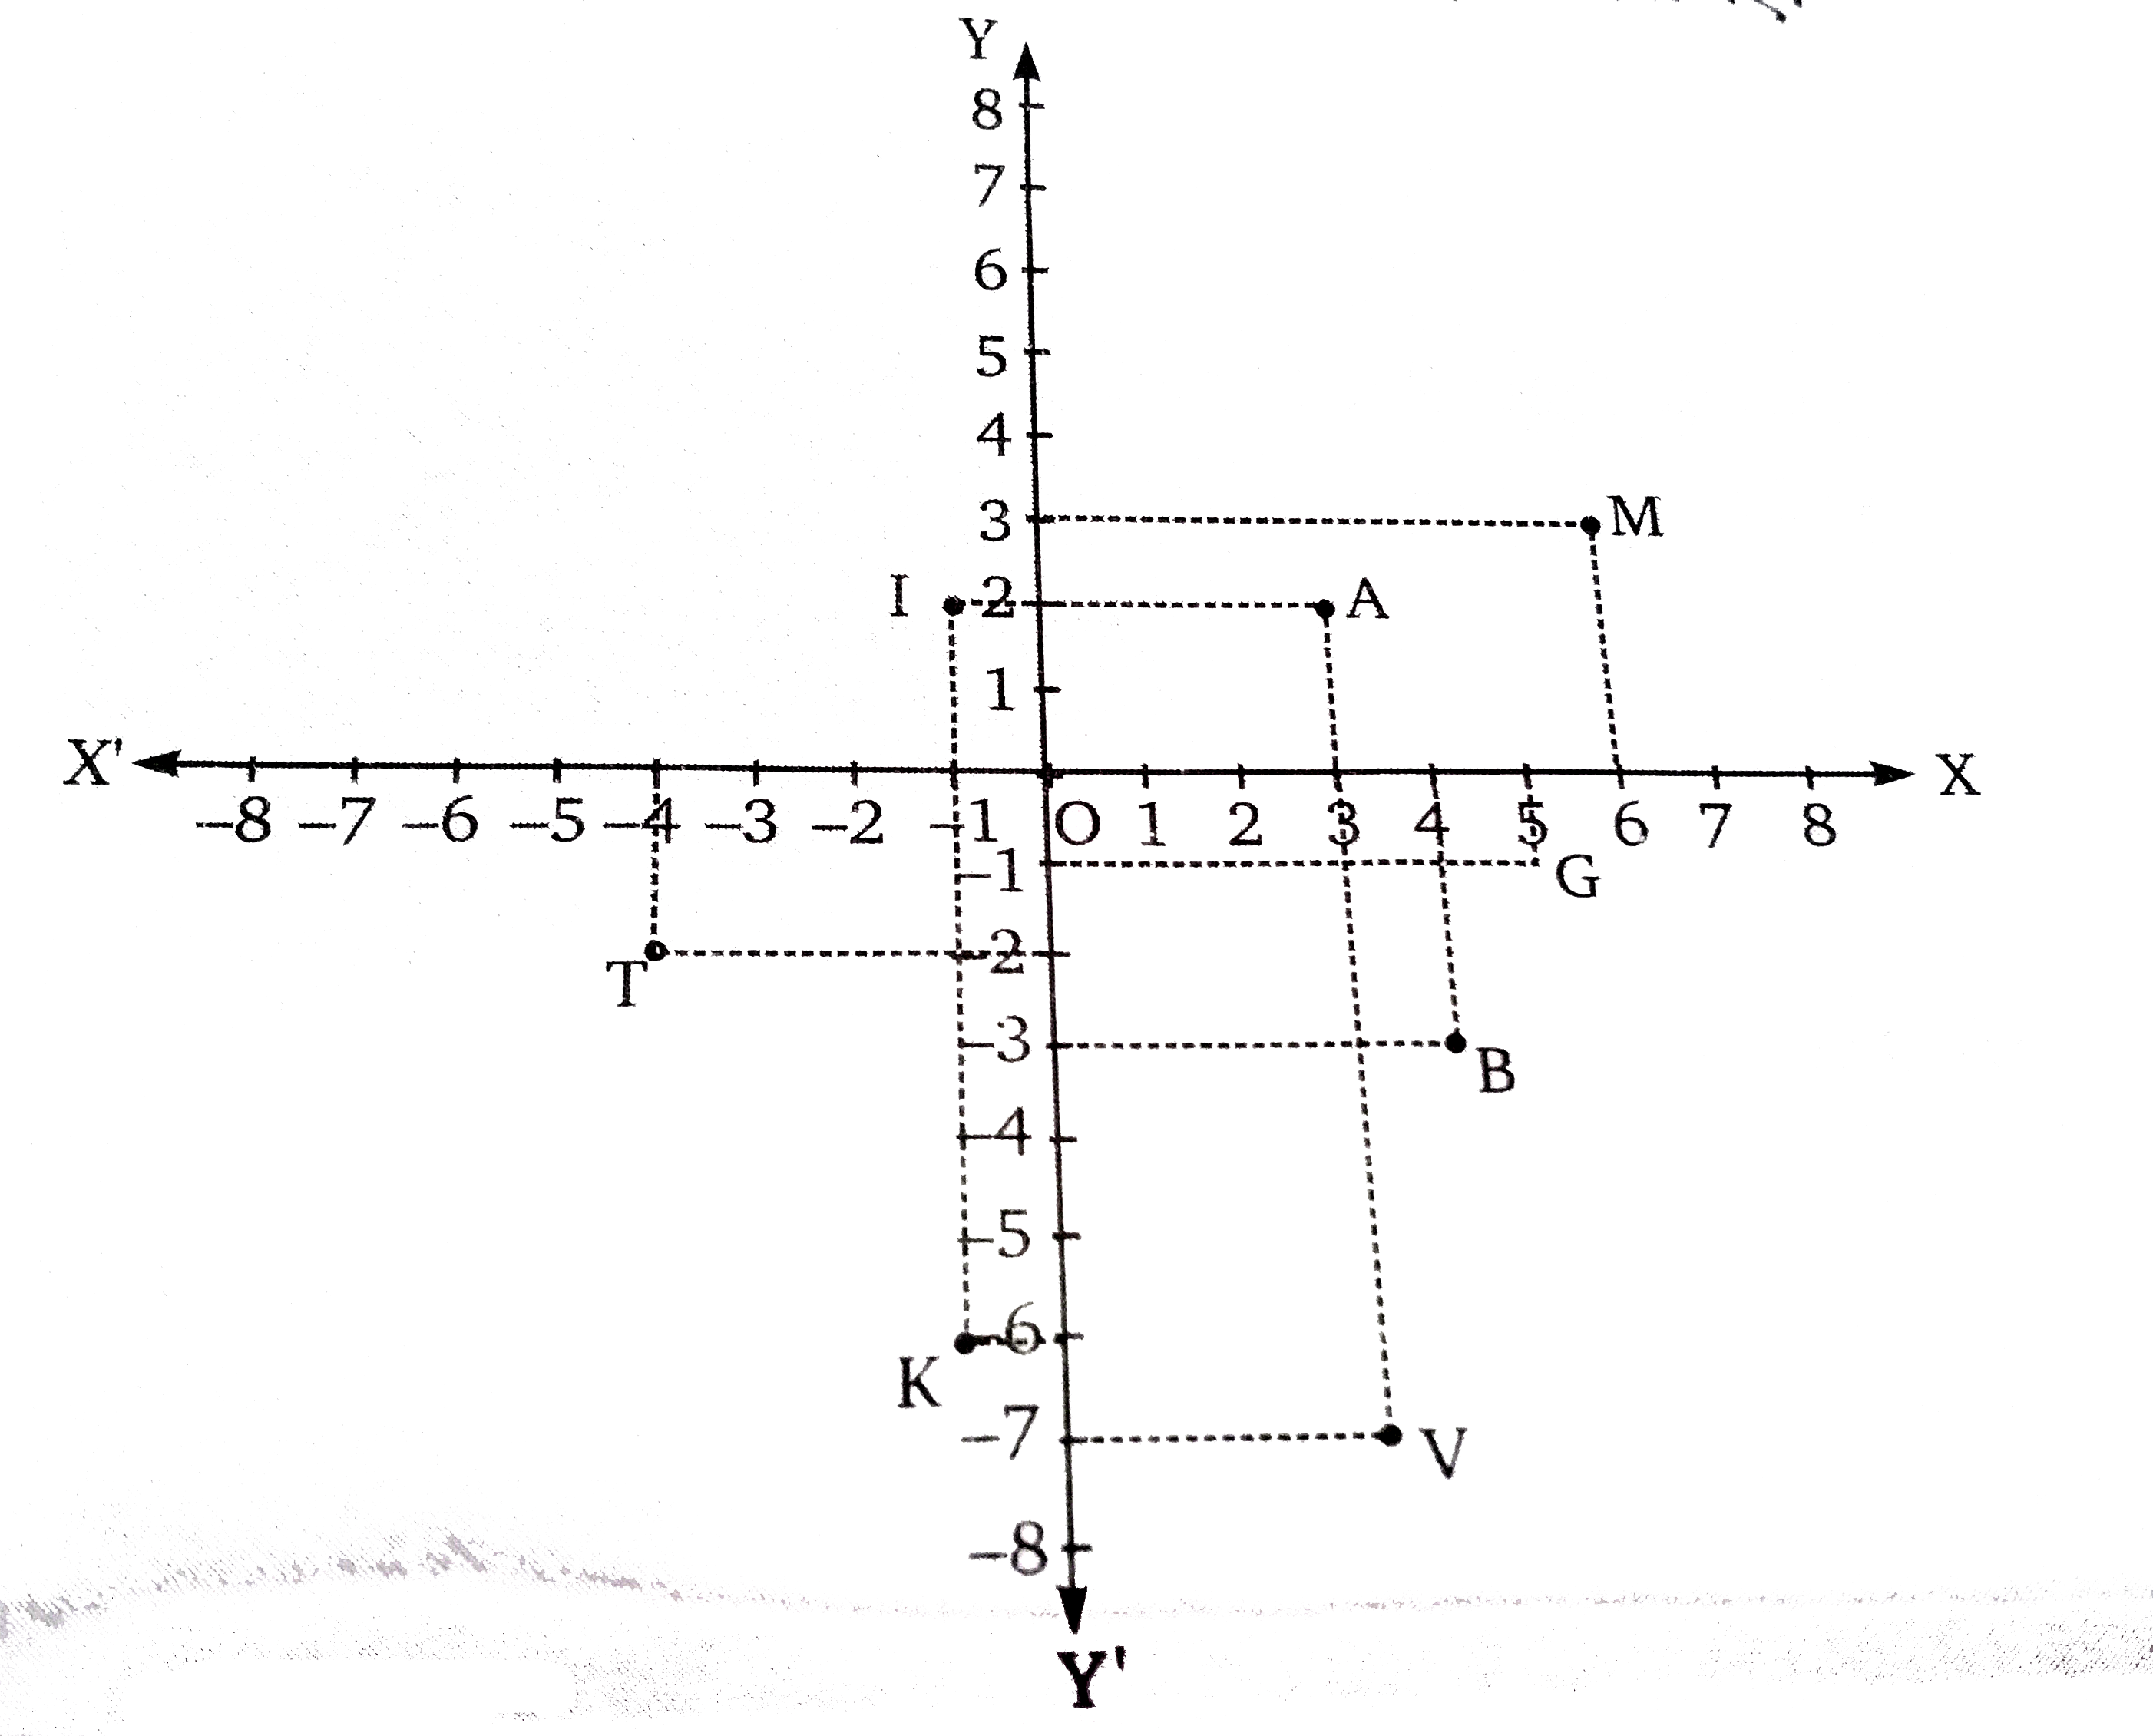
ग्राफ पेपर पर अंकित बिंदुओं के निर्देशांक ज्ञात कीजिए ।

बिंदु A के लिए , बिंदु A की x-अक्ष से दूरी =2 इकाई
बिंदु A की y-अक्ष से दूरी =3 इकाई
∴ अभीष्ट निर्देशांक :A(3,2)
बिंदु K के लिए ,x- अक्ष पर अंकित बिंदु =-1
y-अक्ष पर अंकित बिंदु =-6
∴ अभीष्ट निर्देशांक :K(−1,−6)
इसी प्रकार हम अन्य बिंदुओं के निम्न निर्देशांक ज्ञात कर सकते है -
M(6,3),I(−1,2),T(−4,−2),B(4,−3),V(3,−7),G(5,−1)
Topper's Solved these Questions
- निर्देशांक ज्यामिति BOOK - BALAJI PUBLICATIONCHAPTER - निर्देशांक ज्यामिति EXERCISE - अतिलघु उत्तरीय प्रश्न
5 Videos
- निर्देशांक ज्यामिति BOOK - BALAJI PUBLICATIONCHAPTER - निर्देशांक ज्यामिति EXERCISE - लघु उत्तरीय प्रश्न -I
5 Videos
- दो चरो के रैखिक समीकरण BOOK - BALAJI PUBLICATIONCHAPTER - दो चरो के रैखिक समीकरण EXERCISE - स्वमूल्यांकन परीक्षण
18 Videos
- परिमेयीकरणBOOK - BALAJI PUBLICATIONCHAPTER - परिमेयीकरणEXERCISE - स्वमूल्यांकन परीक्षण
18 Videos
Similar Questions
किसी बिंदु का भुज किस चतुर्थांश में ऋणात्मक होता है ?
View Solutionवह चतुर्थांश ज्ञात कीजिए जिसमे निम्न बिंदु स्थित है -
(i)(−1,−4) (ii)(4,1) (iii)(3,−2) (iv)(−3,1)
(v)(7,2) (vi)(−3,−2) (vii)(−6,4) (viii)(2,−2)
View Solutionएक पुस्तक का मूल्य, एक पैन के मूल्य से दो गुना है | इसे व्यक्त करने के लिए दो चरो का रैखिक समीकरण लिखिये |
View Solution5√3−√5 के हर का परिमेयीकरण कीजिए ।
View SolutionHow many lines of symmetry does the above figure have ?
View SolutionWhich of the following are correct chain isomers of butane ? (i)
View SolutionDetermine the point of symmetry of a regular hexagon.
View SolutionDtermine the images of the following figure about the given line :
View SolutionMatch the following Column A to Column B

View SolutionMatch the following Column A to Column B

View SolutionMatch the following Column A to Column B

View SolutionFind the area of the figure given below.

View SolutionThe area of the shaded part in the figure given below is ______.

View SolutionThe inequation represented by the graph given below is :
View SolutionThe inequation that best describes the graph given below is _________
View SolutionThe inequation that best describes the following graph is _________
View Solution
