a) Explain "birth rate" in a population by taking a suitable example.
b) Write the other two characteristics which only a population shows but an individual cannot.
Step-by-Step Solution
1. Definition of Birth Rate: Birth rate, also known as natality, refers to the number of live births in a population over a specific period of time. It is typically expressed as the number of births per 1,000 individuals per year.
2. Example: Consider a pond with 20 aquatic plants. If we introduce 5 additional plants into the pond, the total population of plants becomes 25.
3. Calculating Birth Rate:
- Initial population = 20 plants
- New plants added = 5 plants
- Total population after addition = 20 + 5 = 25 plants
- To find the birth rate, we can use the formula:
Birth Rate=Number of New BirthsInitial Population=520=0.25
- This means that the birth rate is 0.25, which can also be expressed as 25 births per 100 individuals if we scale it up.
4. Time Frame: The birth rate can be adjusted based on the time frame provided (e.g., per week, per month, or per year).
b) Characteristics of a Population
1. Death Rate: The death rate, or mortality rate, measures the number of deaths in a population over a specific period of time. It is calculated similarly to the birth rate and is expressed per 1,000 individuals.
2. Sex Ratio: The sex ratio is the proportion of males to females in a population. It provides insight into the demographic structure of the population and cannot be determined for a single individual.
Summary of Characteristics
- Birth Rate: Reflects the growth of a population.
- Death Rate: Indicates the decline or mortality within a population.
- Sex Ratio: Shows the balance of genders in the population.
- Initial population = 20 plants
- New plants added = 5 plants
- Total population after addition = 20 + 5 = 25 plants
- To find the birth rate, we can use the formula:
Birth Rate=Number of New BirthsInitial Population=520=0.25
- This means that the birth rate is 0.25, which can also be expressed as 25 births per 100 individuals if we scale it up.
- Death Rate: Indicates the decline or mortality within a population.
- Sex Ratio: Shows the balance of genders in the population.
Topper's Solved these Questions
- BOOK - XII BOARD PREVIOUS YEAR PAPER ENGLISHCHAPTER - XII BOARDSEXERCISE - Section D13videos
XII BOARDS
- BOOK - XII BOARD PREVIOUS YEAR PAPER ENGLISHCHAPTER - XII BOARDSEXERCISE - SET -I Section -A8videos
XII BOARDS
- BOOK - XII BOARD PREVIOUS YEAR PAPER ENGLISHCHAPTER - XII BOARDSEXERCISE - Section B43videos
XII BOARDS
- BOOK - XII BOARD PREVIOUS YEAR PAPER ENGLISHCHAPTER - SAMPLE PAPER 2019EXERCISE - Section E Part B3videos
SAMPLE PAPER 2019
Similar Questions
a) Explain "death rate" in a population by taking a suitable example.
b) Write the other two characteristics which only a population shows but an individual cannot.View SolutionExplain the birth rate and death rate in population with the help of an example.
View Solution(a) Explain Mendel's law of independent assortment by taking a suitable example.
(b) How did Morgan show the deviation in inheritance pattern in Drosophila with respect to this law?View Solution(a) Explain Mendel's law of independent assortment by taking a suitable example.
(b) How did Morgan show the deviation in inheritance pattern in Drosophila with respect to this law?View SolutionAssertion : The rate at which a population can be expected to grow in the future can be assessed graphically by means ofa population pyrmid.
Reason : A triangular population pyramid is characteristics of a country whose population is stable, neither growing nor shrinking.View Solutiona) Explain Darwinian theory of evolution with the help of one suitable example. State the two key concepts of the theory.
b) Mention any three characteristics of Neanderthal man that lived in near east and central Asia.View Solution(a ) Write the Hardy-Weinberg principle.
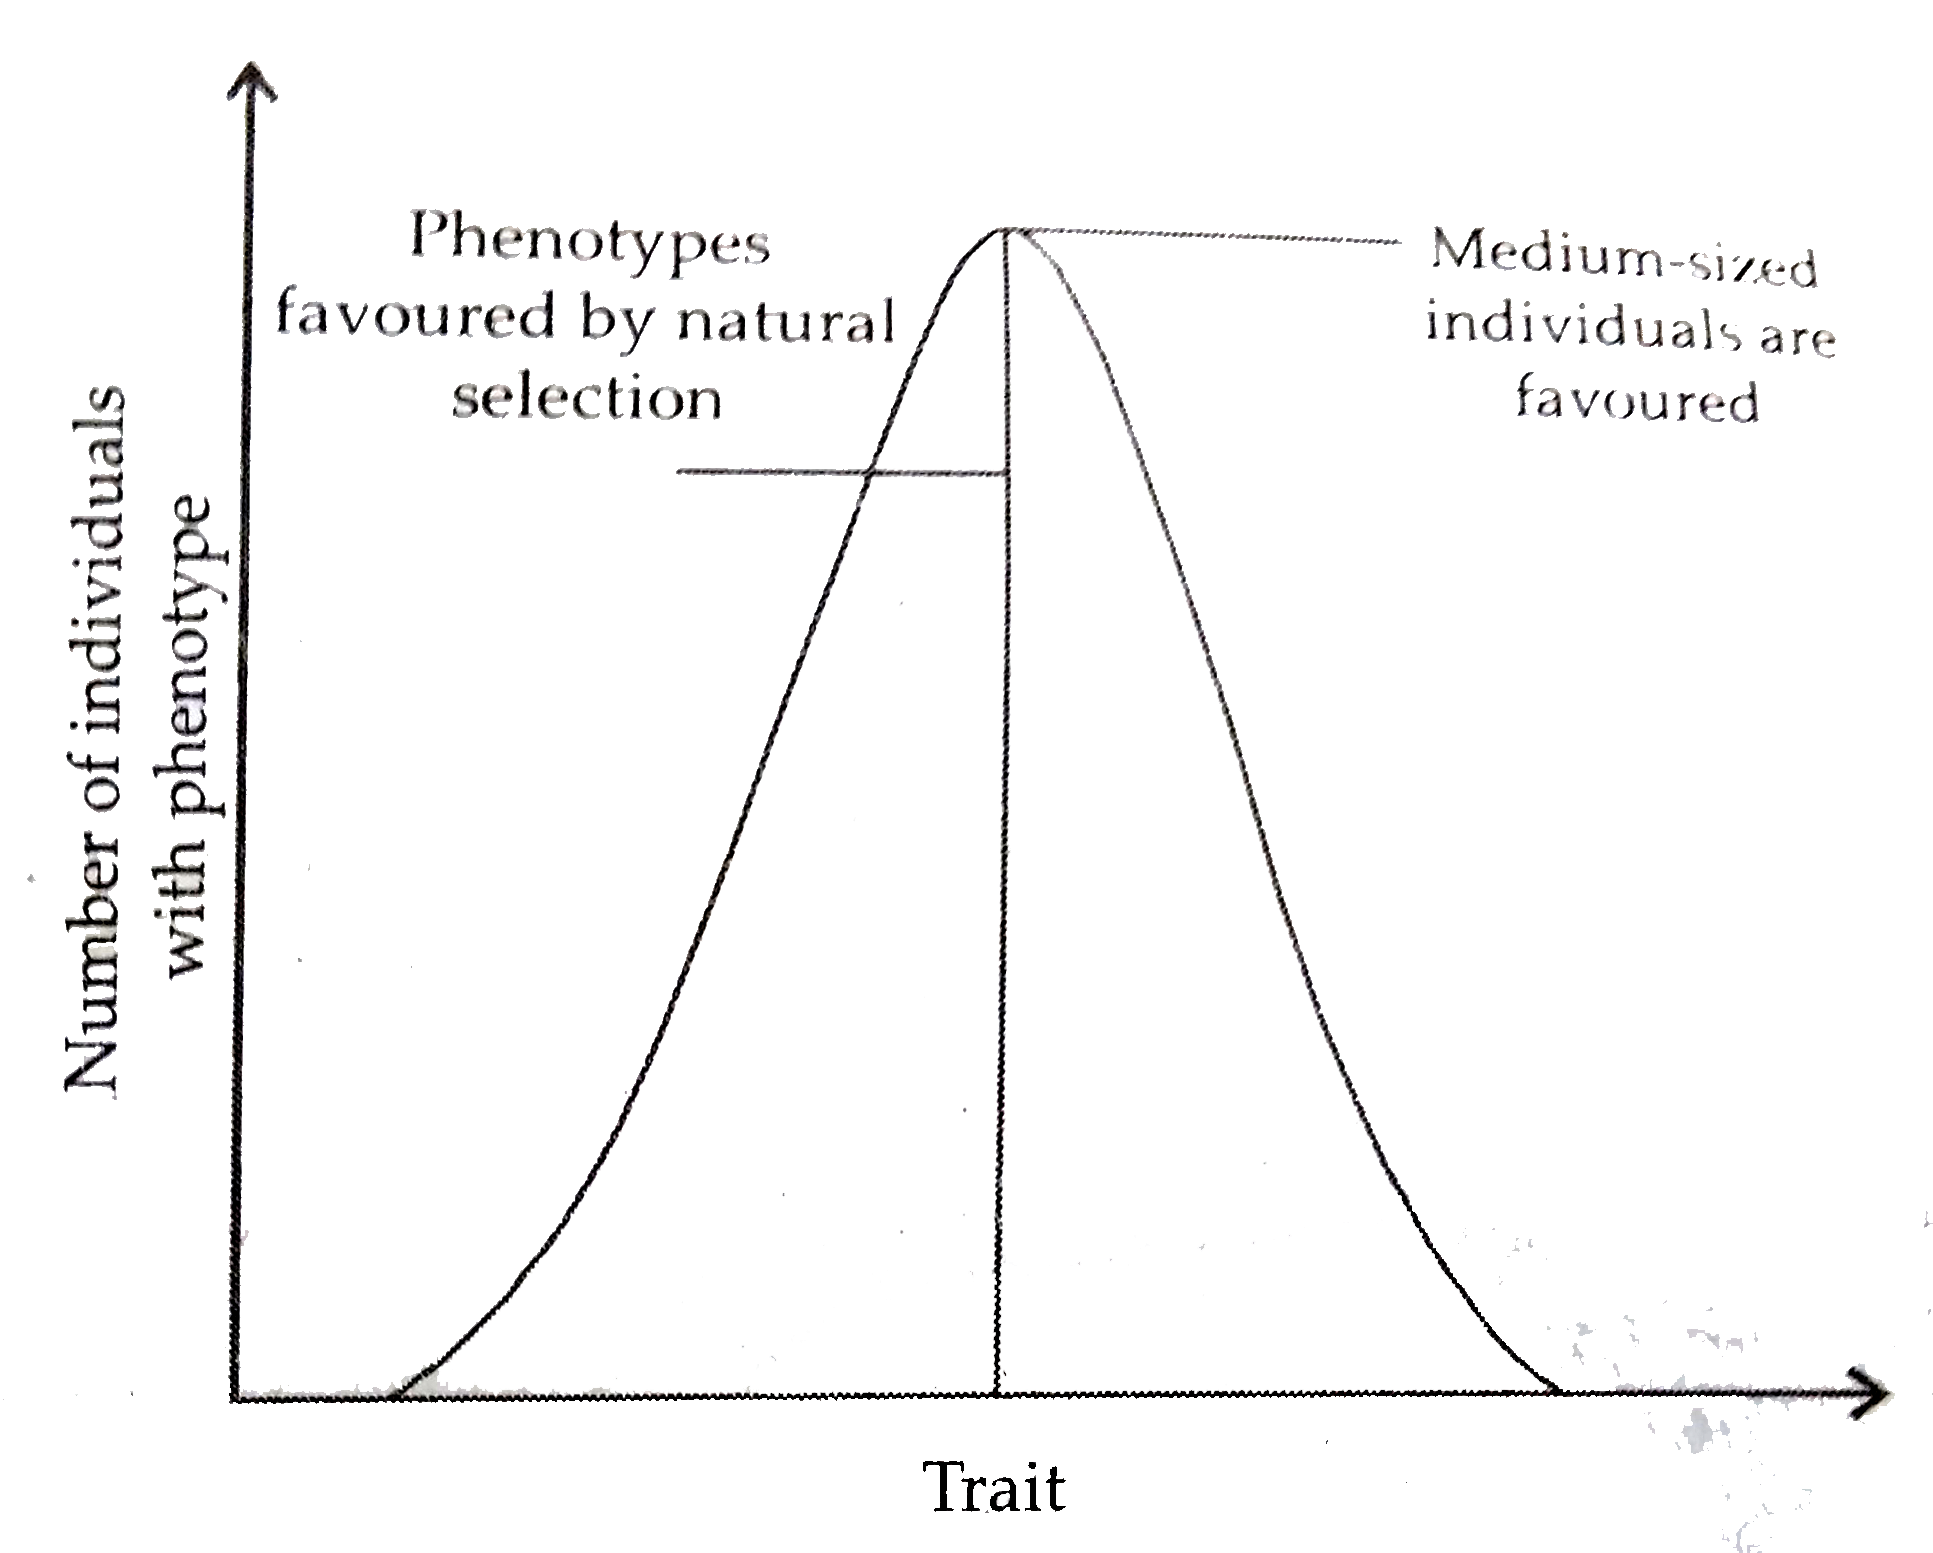
(b) Explain the three different ways in which natural selection can affect the frequency of a heritable trait in a population shown in the graph given below.
 View Solution
(a ) Write the Hardy-Weinberg principle.
(b) Explain the three different ways in which natural selection can affect the frequency of a heritable trait in a population shown in the graph given below.
 View Solution
Explain codominance taking an example of human blood groups in the population.
View Solution(a) Explain sigma and pi bonds with suitable examples,
(b) A pi bond cannot be formed in the absence of sigma bond. Discuss.View Solution

