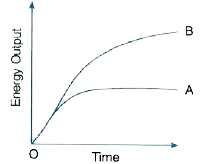
A graph (Fig. 6 . 10) was plotted to show the energy output of two types of respiration. Identify the types of respiration denoted by curves A and B .

Curve A - Anaerobic respiration (less energy).
Curve B - Aerobic respiration (more energy).
Topper's Solved these Questions
- LIFE PROCESSESBOOK - U-LIKE SERIESCHAPTER - LIFE PROCESSESEXERCISE - Short answer questions
39 Videos
- LIFE PROCESSESBOOK - U-LIKE SERIESCHAPTER - LIFE PROCESSESEXERCISE - Long answer questions
22 Videos
- LIFE PROCESSESBOOK - U-LIKE SERIESCHAPTER - LIFE PROCESSESEXERCISE - Assertion - reason questions
4 Videos
- HOW DO ORGANISMS REPRODUCE ?BOOK - U-LIKE SERIESCHAPTER - HOW DO ORGANISMS REPRODUCE ?EXERCISE - LONG ANSWER QUESTIONS
47 Videos
- OUR ENVIRONMENTBOOK - U-LIKE SERIESCHAPTER - OUR ENVIRONMENTEXERCISE - SHORT ANSWER QUESTIONS
34 Videos
Similar Questions
Describe the two types of respiration,
View SolutionThe two types of respirations are_____and______
View SolutionIn which type of respiration, aerobic or anaerobic, more energy is released ?
View SolutionThe two types of respiration are _______ and _______
View SolutionWith regard to energy production , which type of respiration is more efficient ? Why is it so ?
View SolutionIn which type of respiration, aerobic or anaerobic, more energy is released ?
View SolutionIdentify the type of respiration in which the glucose undergoes oxidation and also mention where it takes place.
View SolutionWrite balanced chemical equation for the reactions that take place during respiration . Identify the type of combination reaction that taken place during this process and justify the name. Give one more example of this type of reaction.
View SolutionIdentify the type of reaction (Exothermic/Endothermic)
Respiration
Evaporation of water
View SolutionFig. shows I-V curves for two resistors. Identify the ohmic and non-ohmic resistors. Give a reason for your answer

View Solution
