An individual was on a fast for a long period of time. Which cell organelle would be the most likely one to respond to the distress signal?
(a) Nucleolus
(b) ER
(c) Golgi complex
(d) Lysosome
The correct Answer is:D
To determine which cell organelle would respond to a distress signal during a prolonged fast, we can analyze the functions of the given options:
1. Understanding the Context:
- When an individual is fasting for a long time, the body experiences a lack of nutrients and energy sources. This situation creates a distress signal within the cells that needs to be addressed.
2. Evaluating the Options:
- Option A: Nucleolus
- The nucleolus is responsible for producing ribosomal subunits. It does not play a role in responding to distress signals related to nutrient deprivation.
- Conclusion: Not the correct answer.
- Option B: Endoplasmic Reticulum (ER)
- The ER is involved in protein synthesis (rough ER) and lipid synthesis (smooth ER). While it is essential for cellular functions, it does not directly respond to distress signals during starvation.
- Conclusion: Not the correct answer.
- Option C: Golgi Complex
- The Golgi apparatus modifies, packages, and secretes proteins. Similar to the ER, it is crucial for protein processing but does not respond to starvation signals.
- Conclusion: Not the correct answer.
- Option D: Lysosomes
- Lysosomes are known as cellular scavengers. They break down waste materials and can recycle cellular components. During starvation, lysosomes scavenge essential metabolic building blocks to sustain biosynthetic reactions and provide energy.
- Conclusion: This is the correct answer.
3. Final Answer:
- The organelle that would most likely respond to the distress signal during a prolonged fast is Lysosomes (Option D). They play a critical role in managing cellular resources during times of nutrient scarcity.
- When an individual is fasting for a long time, the body experiences a lack of nutrients and energy sources. This situation creates a distress signal within the cells that needs to be addressed.
- Option A: Nucleolus
- The nucleolus is responsible for producing ribosomal subunits. It does not play a role in responding to distress signals related to nutrient deprivation.
- Conclusion: Not the correct answer.
- Option B: Endoplasmic Reticulum (ER)
- The ER is involved in protein synthesis (rough ER) and lipid synthesis (smooth ER). While it is essential for cellular functions, it does not directly respond to distress signals during starvation.
- Conclusion: Not the correct answer.
- Option C: Golgi Complex
- The Golgi apparatus modifies, packages, and secretes proteins. Similar to the ER, it is crucial for protein processing but does not respond to starvation signals.
- Conclusion: Not the correct answer.
- Option D: Lysosomes
- Lysosomes are known as cellular scavengers. They break down waste materials and can recycle cellular components. During starvation, lysosomes scavenge essential metabolic building blocks to sustain biosynthetic reactions and provide energy.
- Conclusion: This is the correct answer.
- The organelle that would most likely respond to the distress signal during a prolonged fast is Lysosomes (Option D). They play a critical role in managing cellular resources during times of nutrient scarcity.
Topper's Solved these Questions
Similar Questions
Knowledge Check

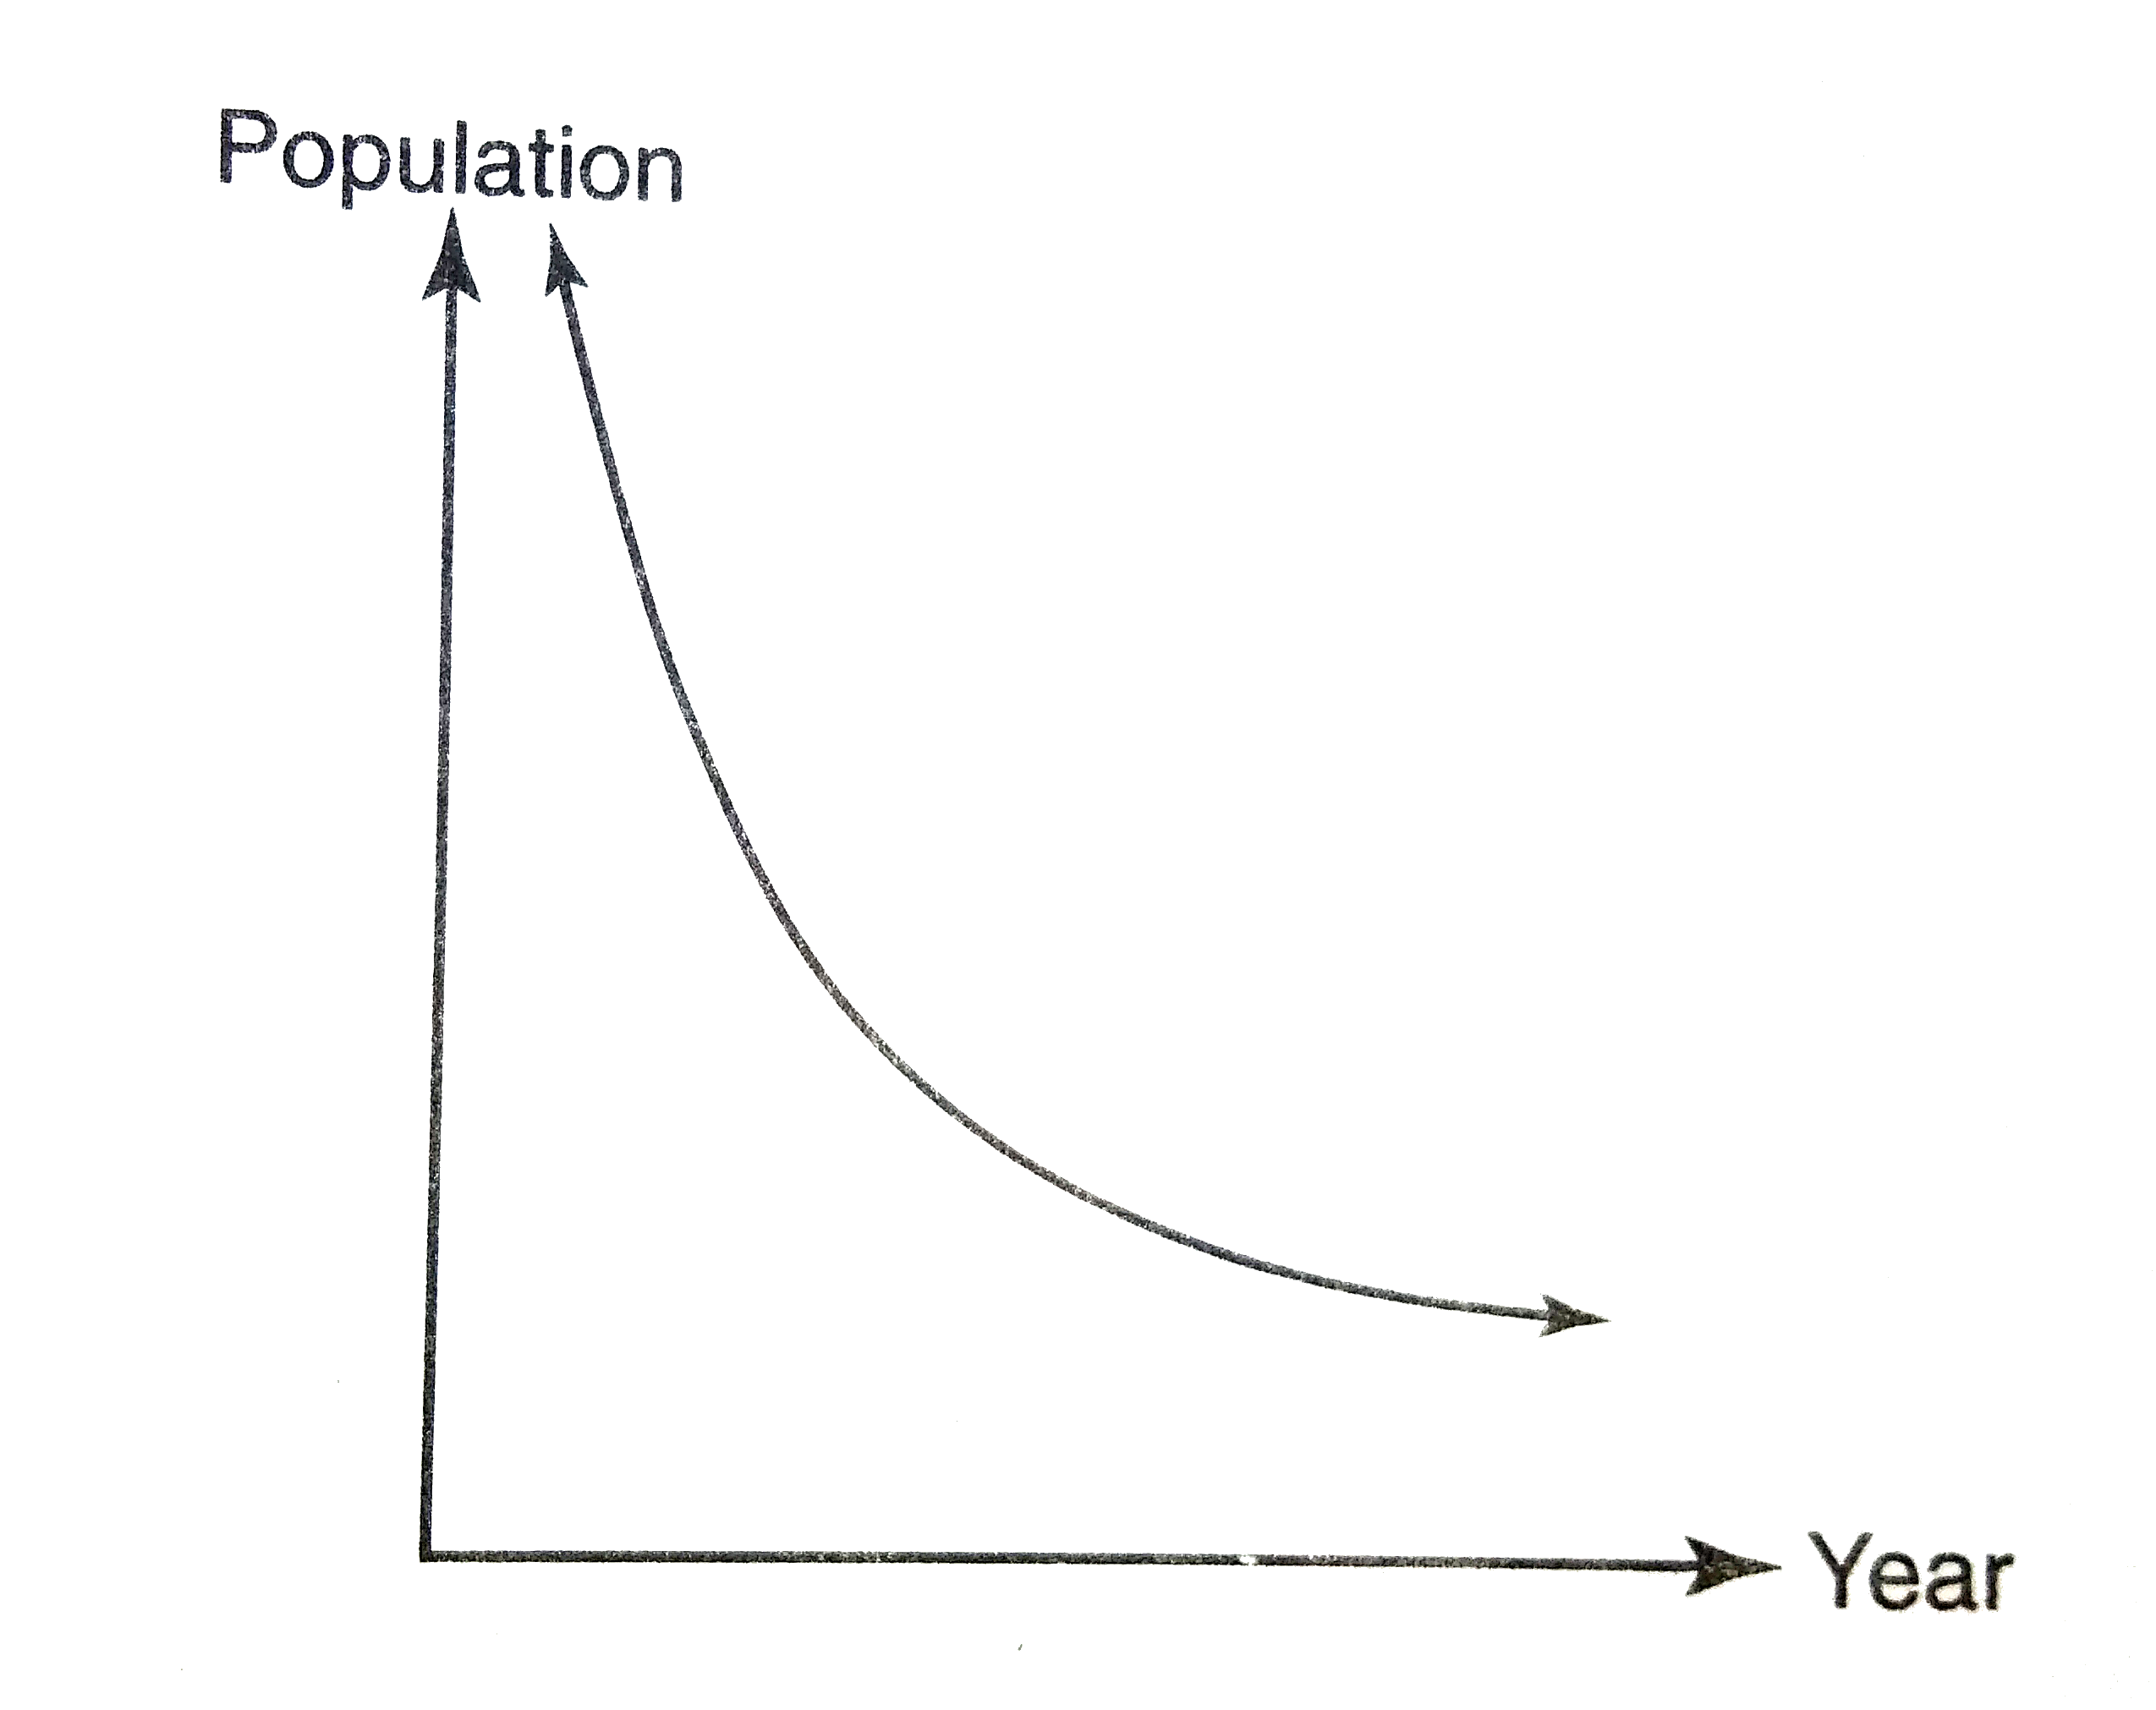
The graph above shows how the size of a country's population has changed over time. Which of the following are the most likely underlying reasons for the type of graph shown?AA moderate increase in annual birthrates and a liberal immigration policy.BA large increase in annual birhtrates and increased life expectancy rates.CA liberal immigration policy and a opportunities.DThe spread of a highly contagius fatal disease and a history of political strife and unrest.Which of these types of cells is most likely to divide ?
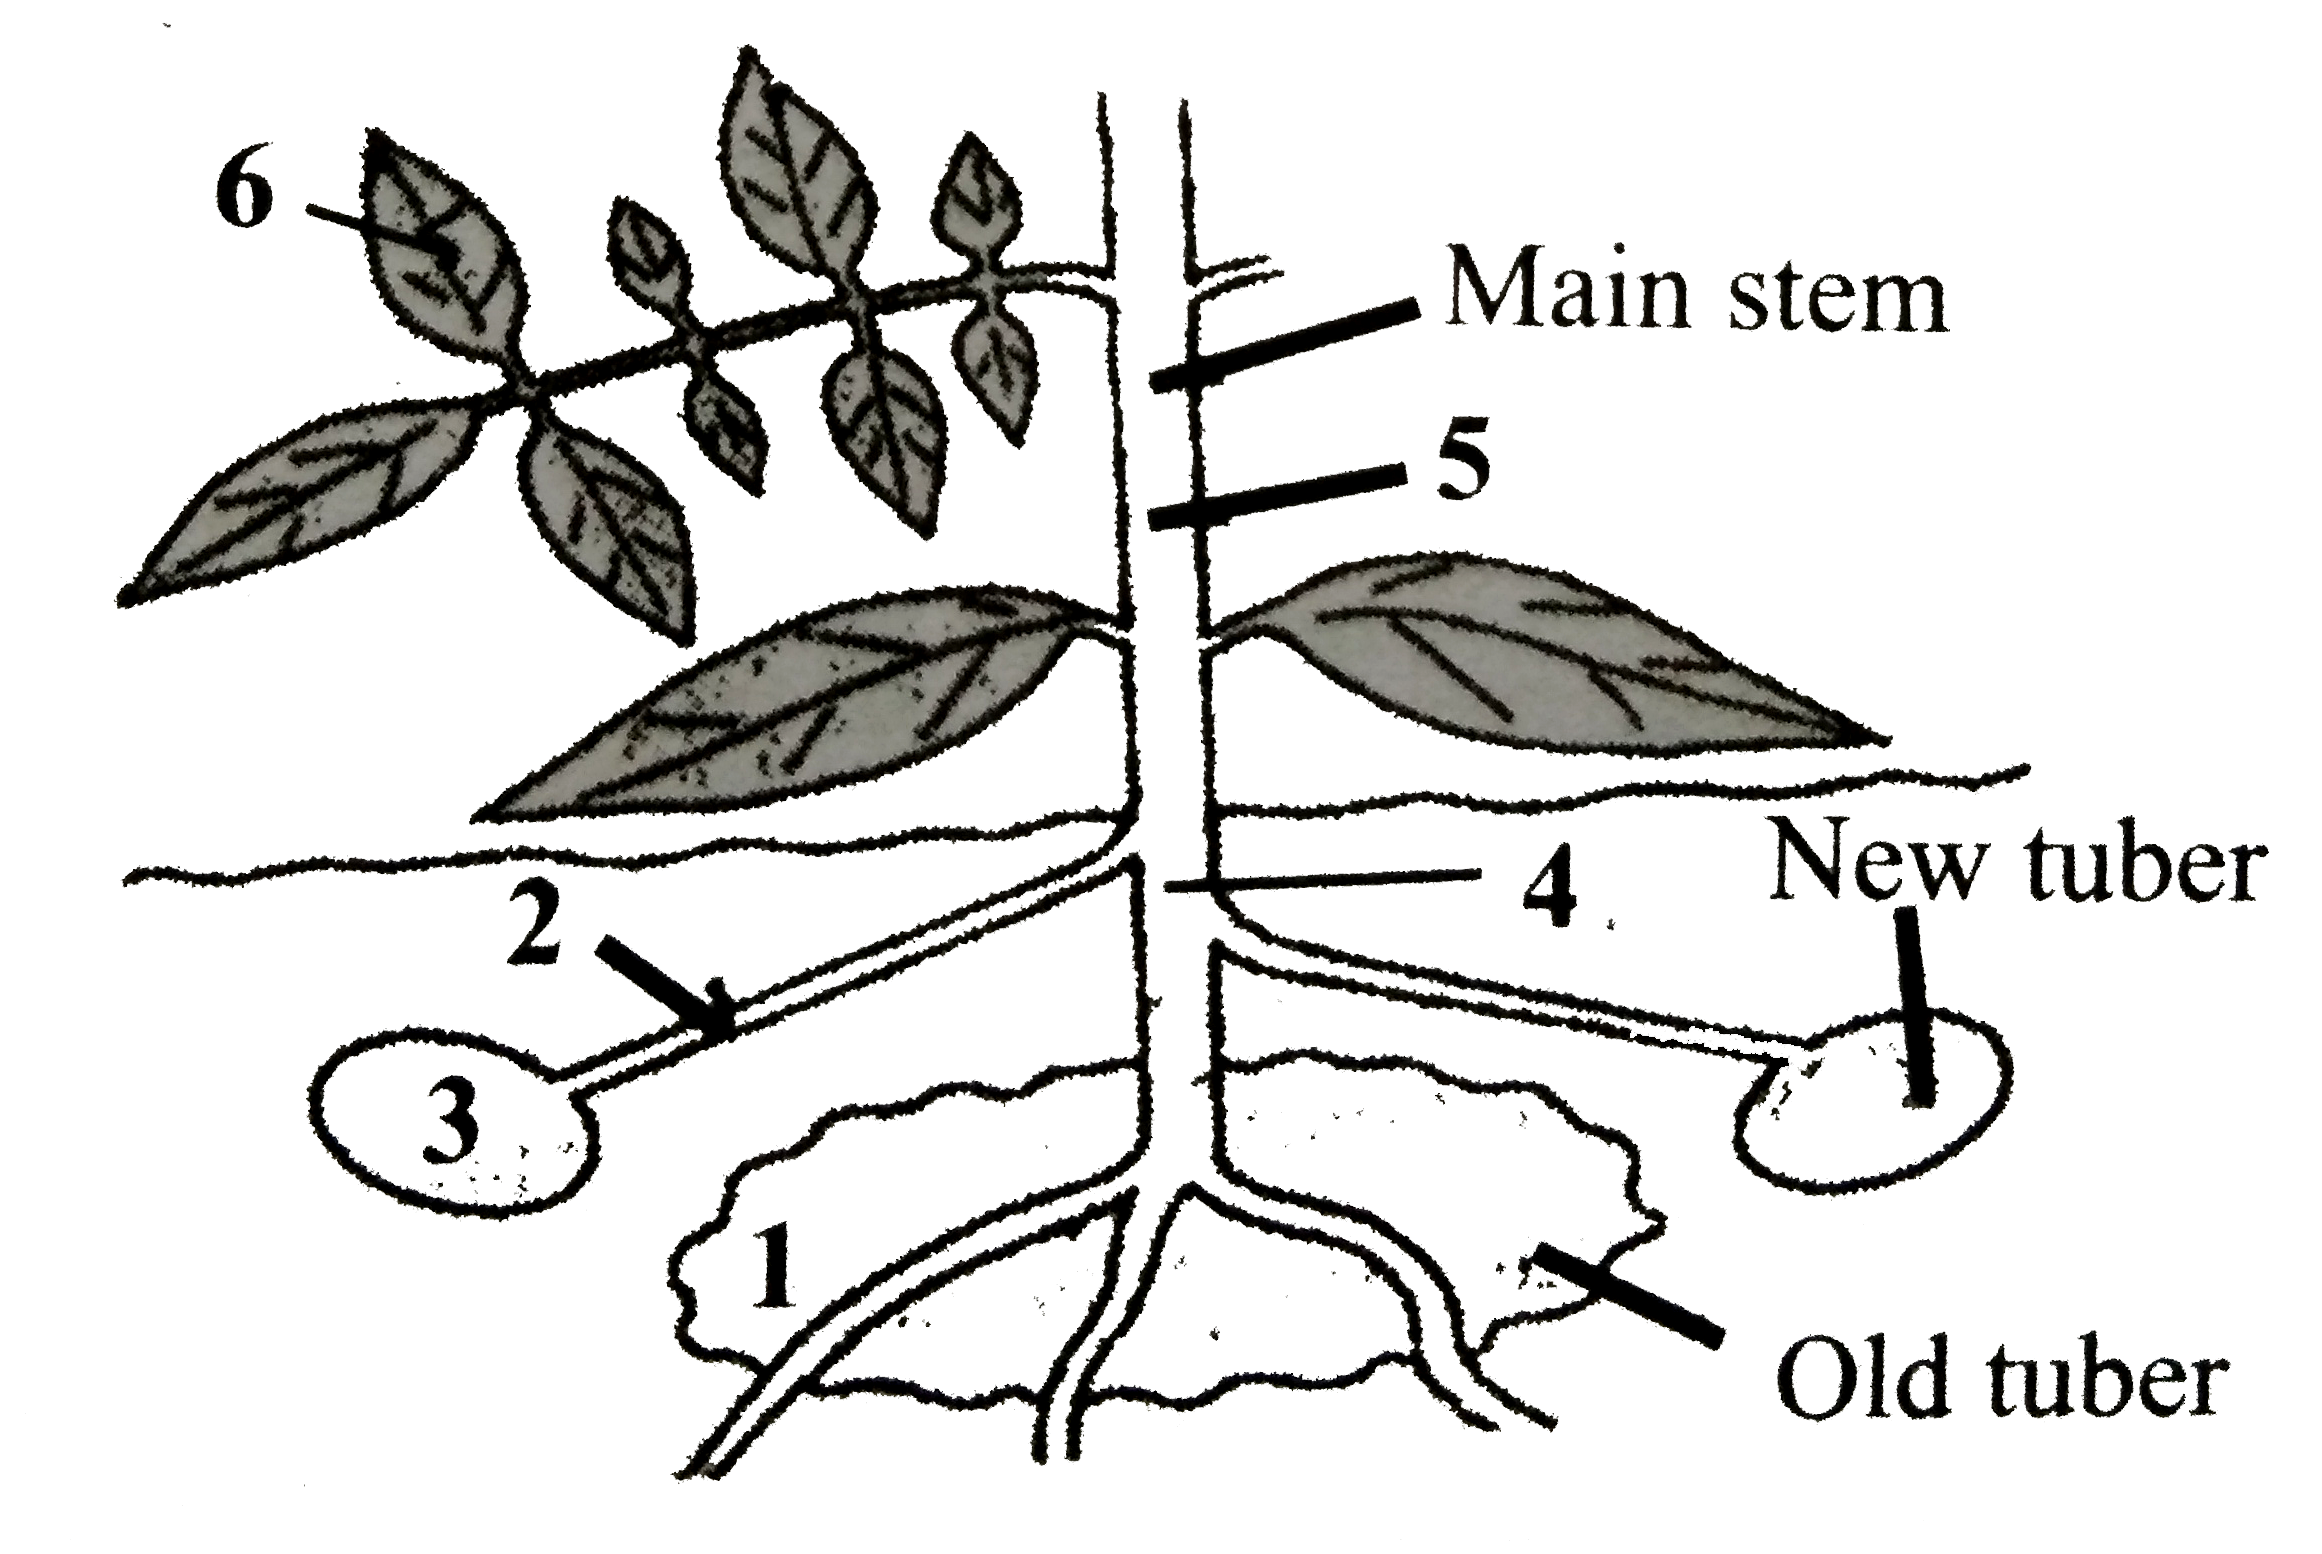
AMeristemBParenchymaCXylemDEpidermisThe given diagram shows a potato plant forming new tubers.
Which route would be taken by most of the food at this time
 A1→4→2→3B6→5→2→3C1→4→5→6D6→5→4→1
Which of the following would most likely help to snow down the greenhouse effect?
View SolutionThe function of which cell organelle is affected the most due to the deficiency of magnesium ?
View SolutionWhich one is an extracytoplasmic cell organelle
View SolutionWhich one of the following cell organelles is enclosed by a single membrane
View SolutionWhich one of the following cell organelles is enclosed by a single membrane
View Solution
