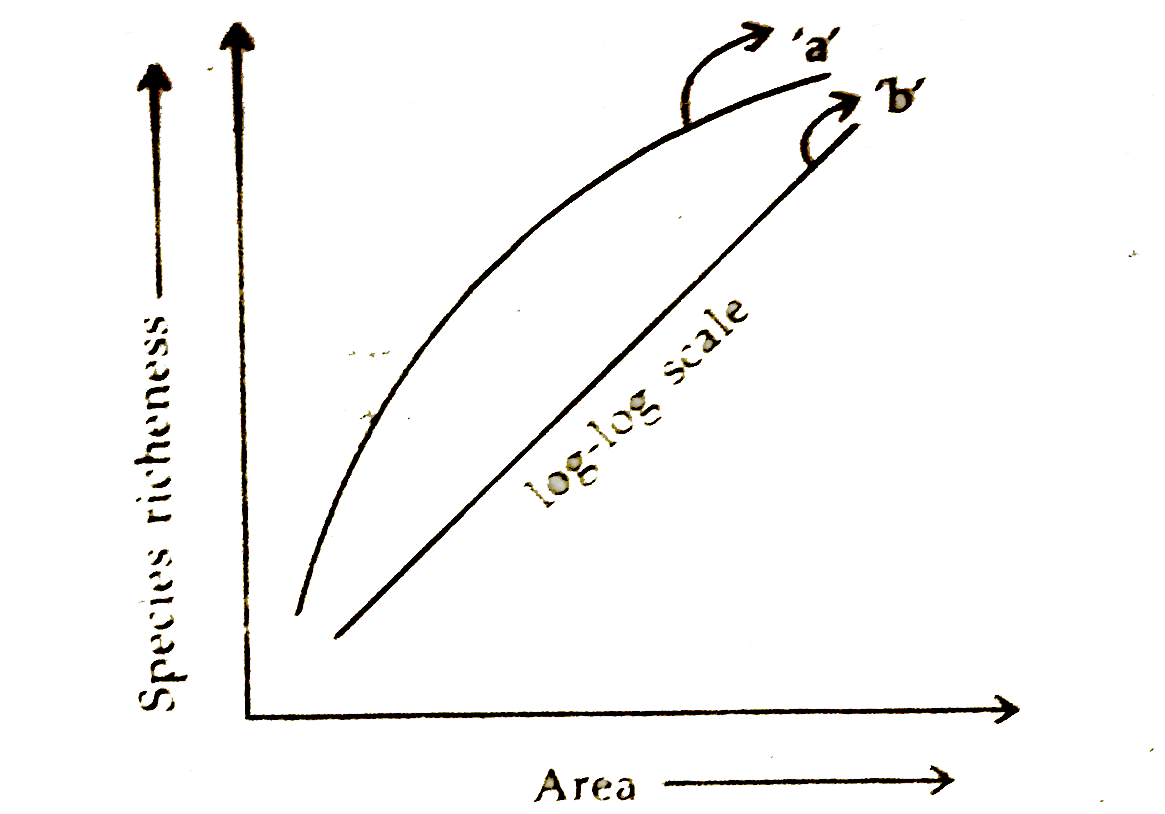
Assertion : If the species-area relationship are analysed among very large areas like the entire continents, the value of Z, i.e., slope of line in the range of 0.1 to 0.2.
Reason : The value of Z, i.e., slope of line of species area relationship lies in the range of 0.6 to 1.2 when analysis is done among small areas.
a) If both assertion and reason are true and reason is the correct explanation of assertion.
b) If both assertion and reason are true but reason is not the correct explanation of assertion.
c) If assertion is true but reason is false.
d) If both assertion and reason are false.
The correct Answer is:D
To solve the question, we need to analyze the assertion and reason provided regarding the species-area relationship.
1. Understanding the Species-Area Relationship:
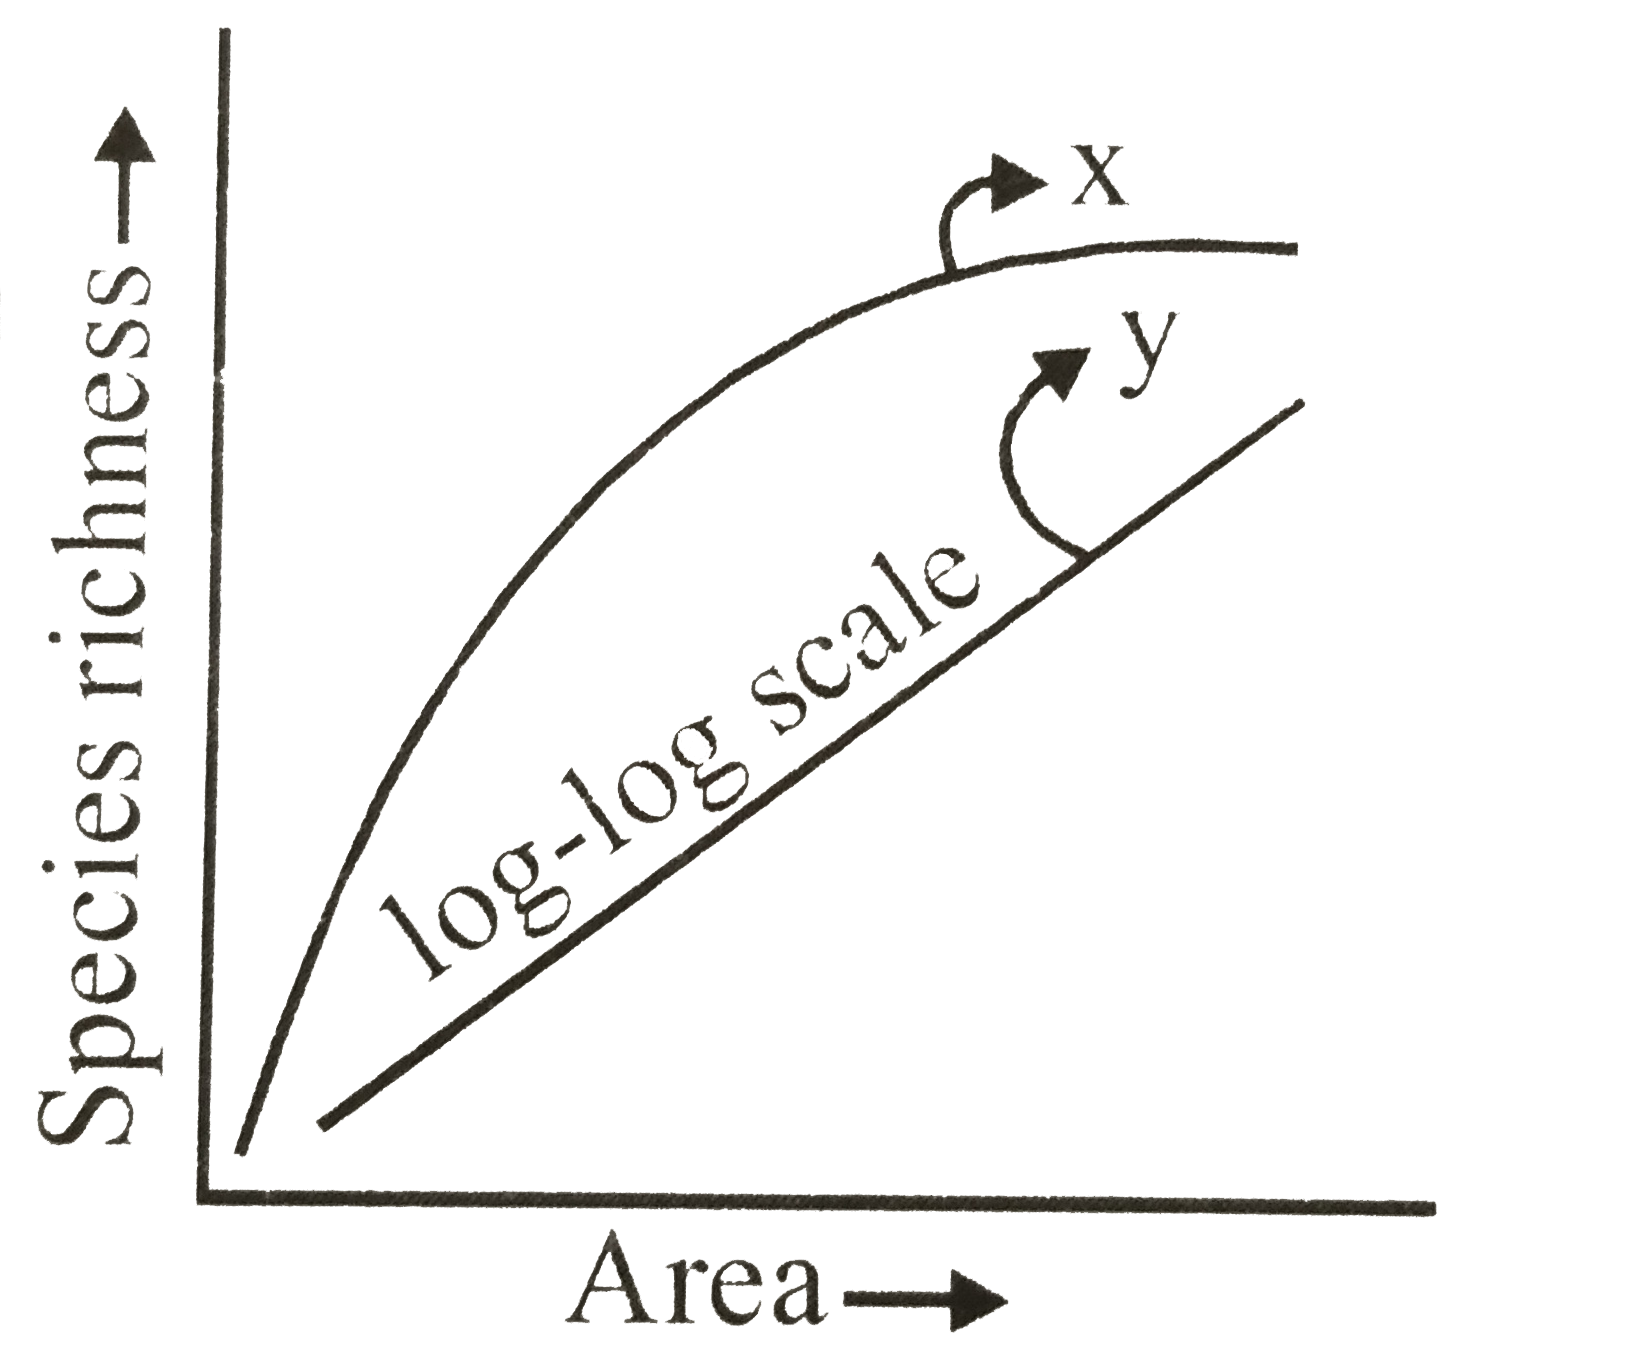
- The species-area relationship is a concept that describes how the number of species (species richness) in a given area relates to the size of that area. This relationship is often represented mathematically as:
logS=logC+Z⋅logA
where S is the number of species, A is the area, C is a constant, and Z is the slope of the line.
2. Analyzing the Assertion:
- The assertion states that for very large areas (like entire continents), the value of Z is between 0.1 to 0.2.
- This statement is incorrect. In reality, when analyzing large areas, the value of Z typically ranges from 0.6 to 1.2.
3. Analyzing the Reason:
- The reason states that for small areas, the value of Z lies in the range of 0.6 to 1.2.
- This statement is also incorrect. For small areas, the value of Z usually ranges from 0.1 to 0.2.
4. Conclusion:
- Both the assertion and the reason are false. Therefore, the correct answer to the question is that both the assertion and the reason are false.
Final Answer:
The correct option is D: Both assertion and reason are false.
---
- The species-area relationship is a concept that describes how the number of species (species richness) in a given area relates to the size of that area. This relationship is often represented mathematically as:
logS=logC+Z⋅logA
where S is the number of species, A is the area, C is a constant, and Z is the slope of the line.
- The assertion states that for very large areas (like entire continents), the value of Z is between 0.1 to 0.2.
- This statement is incorrect. In reality, when analyzing large areas, the value of Z typically ranges from 0.6 to 1.2.
- The reason states that for small areas, the value of Z lies in the range of 0.6 to 1.2.
- This statement is also incorrect. For small areas, the value of Z usually ranges from 0.1 to 0.2.
- Both the assertion and the reason are false. Therefore, the correct answer to the question is that both the assertion and the reason are false.
The correct option is D: Both assertion and reason are false.
Topper's Solved these Questions
- BIODIVERSITY & CONSERVATIONBOOK - NCERT FINGERTPS ENGLISHCHAPTER - BIODIVERSITY & CONSERVATIONEXERCISE - Biodiversity & Conservation
140 Videos
- BIODIVERSITY & CONSERVATIONBOOK - NCERT FINGERTPS ENGLISHCHAPTER - BIODIVERSITY & CONSERVATIONEXERCISE - NCERT (EXEMPLAR PROBLEMS
20 Videos
- BIOTECHNOLOGY - PRINCIPLES AND PROCESSESBOOK - NCERT FINGERTPS ENGLISHCHAPTER - BIOTECHNOLOGY - PRINCIPLES AND PROCESSESEXERCISE - Biotechnology - Principles And Processes
139 Videos
Similar Questions
Fill in the blanks with suitable words in following statements.
(i) Colombia located near the equator has about…….. Species of birds.
(ii) More than 1,25,000 species of………. have been reported in Aamzonian rain forest.
(iii) Favourable and less seasonal enviroments has helped.............organism to gain more niche specialisation.
(iv) Value of slope of regression (Z) of species-area relationship lies in the range of............molluscs in New York state.
View SolutionThe line y=mx bisects the area enclosed by the curve y=1+4x−x2 and the lines x=0,x=32andy=0. Then the value of m is
View SolutionThe following graph shows the species area relationship. Answers the Questions as directed.
(a) Name the naturalist who studied the kind of relationship shown in the graph.
Write the observations made by him.
(b) Write the situations as discovered by the ecologists when the value of 'Z' (slope of the line) lies between
(i) 0.1 and 0.2, (ii) 0.6 and 1.2
What does 'Z' stand for ?
(c ) When would the slope of the line 'b' become steeper ?

View SolutionThe value of Z , the slope of the line ( regression coefficient ) is …..... for mammals in the tropical forest of different continents.
(a) 0.6
(b) 0.8
(c) 1.15
(d) 1.21
View SolutionFind the values of k if area of tringle is 4 sq. units and dvertices are : (i) (k,0), (4,0), (0,2)
View Solution
Study the above graph and answer the following questions -
(i) Identify x and y
(ii) The relation between species richness and area can be denoted as generally
(iii) The value of z lies in range of
(iv) On a log scale the relation between species richness and area is
View SolutionShow that the area bounded by the lines x = 0, y = 1, y = 2 and the hyperbola xy = 1 is log 2.
View SolutionFind the value of t for which the area bounded by the lines y=0,x=0,x=1 and the curve y=t2x2+tx+1 is minimum.
View SolutionTwo sides of a square lie on the lines x+y=1andx+y+2=0. What is its area?
View Solution
