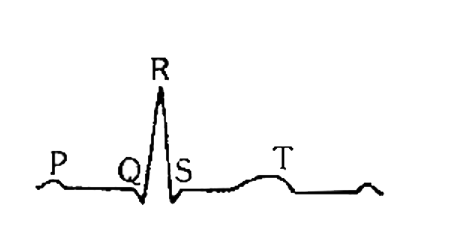
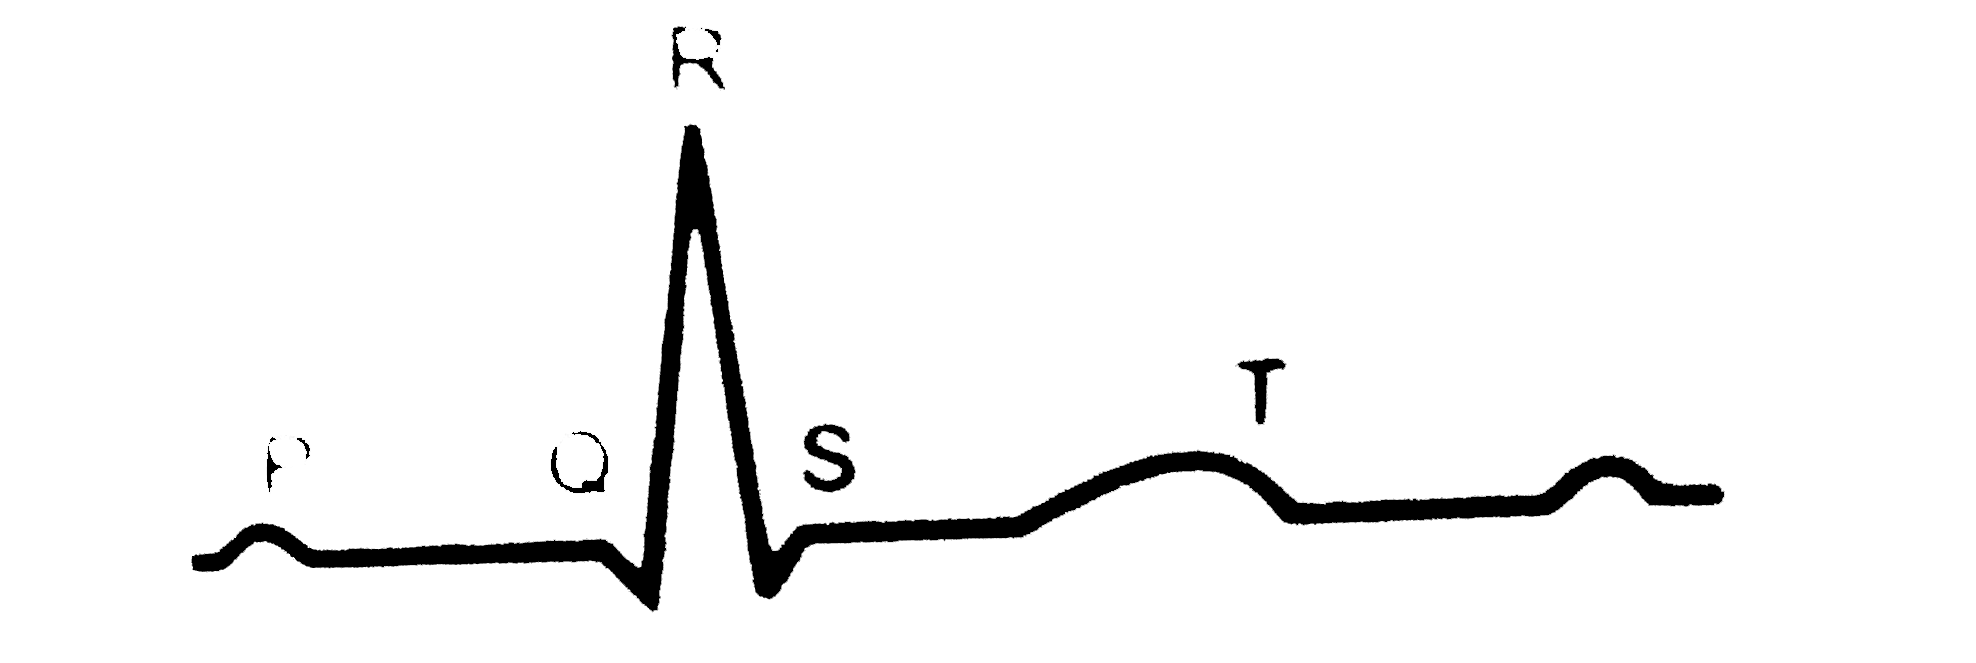
Draw a standard ECG and explain the different segments in it.
Step-by-Step Solution:
1. Understanding ECG:
- The full form of ECG is Electrocardiogram. It is a graphical representation of the electrical activity of the heart during a cardiac cycle.
2. Drawing a Standard ECG:
- Draw a horizontal line to represent the baseline (isoelectric line).
- Mark the following waves and segments:
- P Wave: A small upward deflection indicating atrial depolarization.
- Q Wave: A small downward deflection following the P wave.
- R Wave: A large upward deflection following the Q wave.
- S Wave: A downward deflection following the R wave.
- T Wave: A small upward deflection following the S wave.
- U Wave: (optional) A small wave that may follow the T wave, not always present.
3. Segments of the ECG:
- P Wave: Represents atrial depolarization, which is the electrical impulse that causes the atria to contract.
- PR Interval: The time from the beginning of the P wave to the beginning of the Q wave, representing the time taken for the impulse to travel from the SA node through the AV node.
- QRS Complex: Represents ventricular depolarization, indicating the contraction of the ventricles. It consists of the Q, R, and S waves.
- ST Segment: The flat section between the end of the S wave and the beginning of the T wave, representing the period when the ventricles are depolarized.
- T Wave: Represents ventricular repolarization, which is the recovery phase of the ventricles.
- QT Interval: The time from the beginning of the Q wave to the end of the T wave, indicating the total time for ventricular depolarization and repolarization.
4. Conclusion:
- An ECG provides critical information about the heart's electrical activity and can help diagnose various cardiac conditions.
- The full form of ECG is Electrocardiogram. It is a graphical representation of the electrical activity of the heart during a cardiac cycle.
- Draw a horizontal line to represent the baseline (isoelectric line).
- Mark the following waves and segments:
- P Wave: A small upward deflection indicating atrial depolarization.
- Q Wave: A small downward deflection following the P wave.
- R Wave: A large upward deflection following the Q wave.
- S Wave: A downward deflection following the R wave.
- T Wave: A small upward deflection following the S wave.
- U Wave: (optional) A small wave that may follow the T wave, not always present.
- P Wave: Represents atrial depolarization, which is the electrical impulse that causes the atria to contract.
- PR Interval: The time from the beginning of the P wave to the beginning of the Q wave, representing the time taken for the impulse to travel from the SA node through the AV node.
- QRS Complex: Represents ventricular depolarization, indicating the contraction of the ventricles. It consists of the Q, R, and S waves.
- ST Segment: The flat section between the end of the S wave and the beginning of the T wave, representing the period when the ventricles are depolarized.
- T Wave: Represents ventricular repolarization, which is the recovery phase of the ventricles.
- QT Interval: The time from the beginning of the Q wave to the end of the T wave, indicating the total time for ventricular depolarization and repolarization.
- An ECG provides critical information about the heart's electrical activity and can help diagnose various cardiac conditions.
Topper's Solved these Questions
Similar Questions
Knowledge Check
To obtain a standard ECG, a patient is connected to the machine by three electrodes
AOne to each wrist and to the left ankleBOne to each each ankle and to the left wristCOne to each wrist and to the left wrist regionDOne to each ankle and to the left chest regionAssertion : ECG is a graphical representation of the electrical activity of heart cardiac cycle.
Reason : To obtain a standard ECG, patient is connected to machine with two leads, one with left wrist and one with left ankle.AIf both Assertion & Reason as true & the Reason is a correct explanation of the assertion.BIf both Assertion & Reason are True but Reason is not a correct explanation of the Assertion.CIf Assertion is True but the Reason is False.DIf both Assertion & Reason are false.The T - wave of a standard ECG represents :
ARepolarisation of both ventriclesBReturning of ventricles from excited to normal stateCEnds of T - wave marks the end of systoleDAll of the above
Explain the process or drawing latitudes.
View SolutionThe diagram given here is the standard ECG of a normal person. The P-wave represents the :

View SolutionIn the standard ECG of a normal person, the P-wave represents the
View SolutionThe diagram given here is the standard ECG of a normal person, the P-wave represents the

View Solutionthe diagram given here is the standard ECG of a normal person. The P-wave represents the :

View Solution

