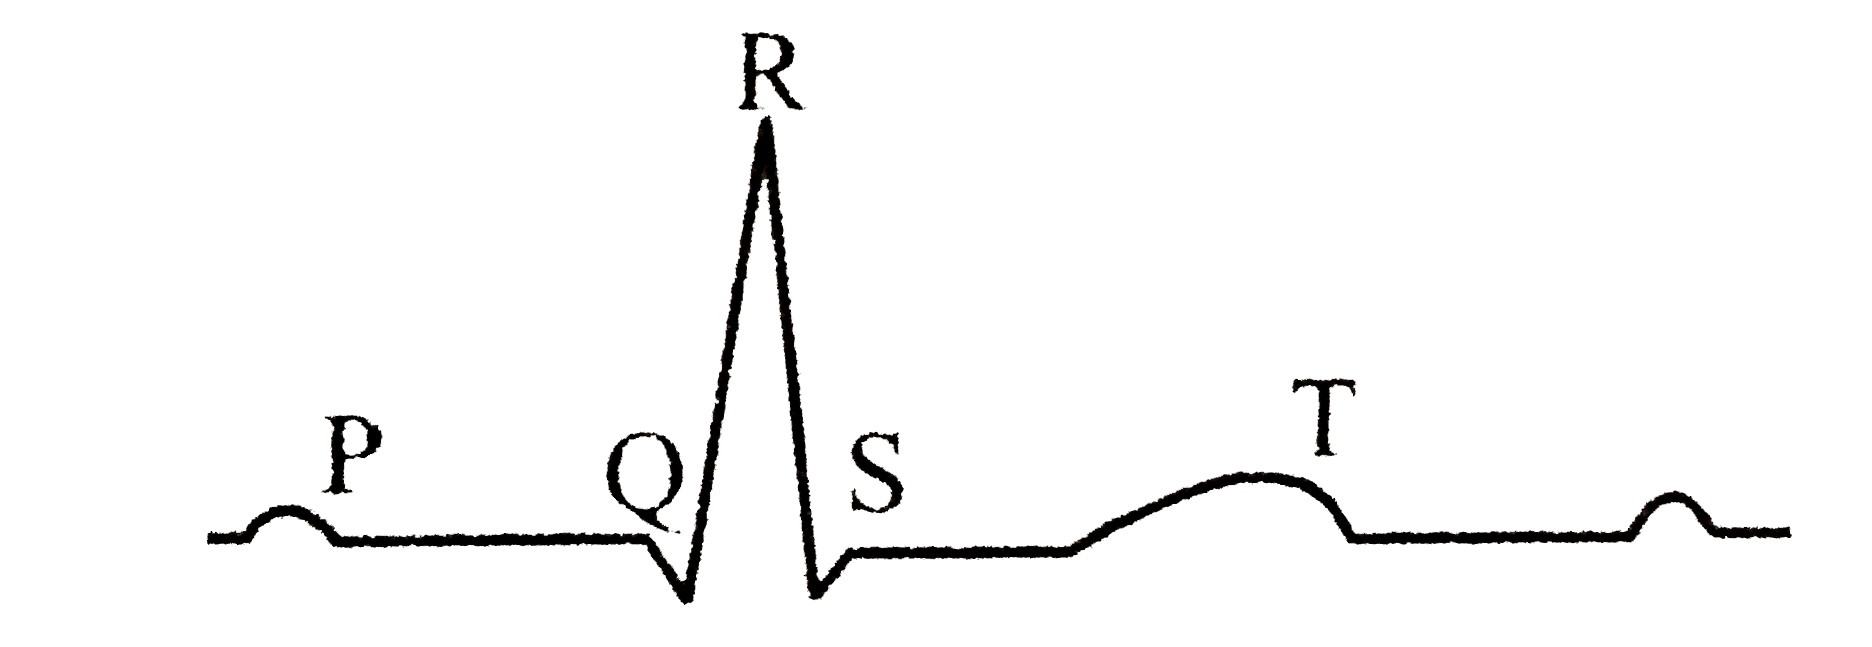
Draw a standard ECG and explain the different segments in it.
Step-by-Step Solution:
1. Understanding ECG: An electrocardiogram (ECG) is a graphical representation of the electrical activity of the heart. It provides important information about the heart's rhythm and electrical conduction.
2. Drawing the ECG:
- Start with a horizontal baseline.
- Draw a small upward wave (P wave) followed by a downward deflection (Q wave), then a large upward spike (R wave), followed by a downward deflection (S wave), and finally a small upward wave (T wave).
- The overall shape should resemble a series of peaks and troughs.
3. Labeling the Components:
- P Wave: Represents atrial depolarization, which is the electrical activity that leads to atrial contraction.
- QRS Complex: Comprises the Q, R, and S waves. It represents ventricular depolarization, which is the electrical activity that leads to ventricular contraction.
- T Wave: Represents ventricular repolarization, indicating the recovery phase of the ventricles after contraction.
4. Identifying Segments:
- PR Interval: The time from the beginning of the P wave to the beginning of the QRS complex. It lasts about 0.2 seconds and indicates the time taken for the electrical impulse to travel from the atria to the ventricles.
- ST Segment: The flat section between the end of the S wave and the beginning of the T wave. It lasts about 0.4 seconds and represents the period when the ventricles are fully depolarized.
- Joint Diastole: This phase occurs after the T wave and indicates that both the atria and ventricles are in a relaxed state.
5. Clinical Significance: Abnormalities in the P wave, QRS complex, or T wave can indicate various cardiac issues, such as arrhythmias or ischemia.
- Start with a horizontal baseline.
- Draw a small upward wave (P wave) followed by a downward deflection (Q wave), then a large upward spike (R wave), followed by a downward deflection (S wave), and finally a small upward wave (T wave).
- The overall shape should resemble a series of peaks and troughs.
- P Wave: Represents atrial depolarization, which is the electrical activity that leads to atrial contraction.
- QRS Complex: Comprises the Q, R, and S waves. It represents ventricular depolarization, which is the electrical activity that leads to ventricular contraction.
- T Wave: Represents ventricular repolarization, indicating the recovery phase of the ventricles after contraction.
- PR Interval: The time from the beginning of the P wave to the beginning of the QRS complex. It lasts about 0.2 seconds and indicates the time taken for the electrical impulse to travel from the atria to the ventricles.
- ST Segment: The flat section between the end of the S wave and the beginning of the T wave. It lasts about 0.4 seconds and represents the period when the ventricles are fully depolarized.
- Joint Diastole: This phase occurs after the T wave and indicates that both the atria and ventricles are in a relaxed state.
Similar Questions
Knowledge Check
- Question 1 - Select One
Examine the diagrammatic representation of standard ECG. Select an option with correct matching
 AP-WaveORS complexT-waveRepolarisationof the atriaRepolarisationof the ventriclesDepolarisationof the atriaBP-WaveORS complexT-waveDepolarisationof the atriaDepolarisationof the ventriclesRepolarisationof the ventriclesCP-WaveORS complexT-waveRepolarisationof the ventriclesRepolarisationof the atriaDepolarisationof the ventriclesDP-WaveORS complexT-waveRepolarisationof the ventriclesDepolarisationof the atriaRepolarisationof the atria
 - Question 2 - Select One
In a standard ECG which one of the following alphabets is the correct representation of the respective activity of the human heart ?
AS - start of systoleBT - end of diastoleCP - depolarisation of the atriaDR - repolarisastion of ventricles
Draw and identify different elements of phloem.
View SolutionT wave in a standard ECG represents
View SolutionTo obtain a standard ECG, a patient is connected to the machine by three electrodes
View SolutionAssertion : ECG is a graphical representation of the electrical activity of heart cardiac cycle.
Reason : To obtain a standard ECG, patient is connected to machine with two leads, one with left wrist and one with left ankle.View SolutionGiven below is the diagrammatic representation of a standard ECG.Lable its different peaks.
 View Solution
In a standard ECG which one of the following alphabets is the correct representation of the respective activity of the human heart ?
View Solution

