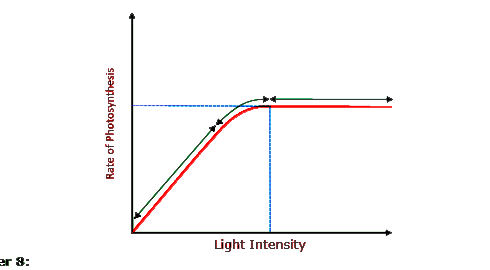
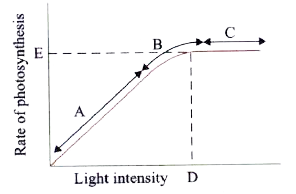
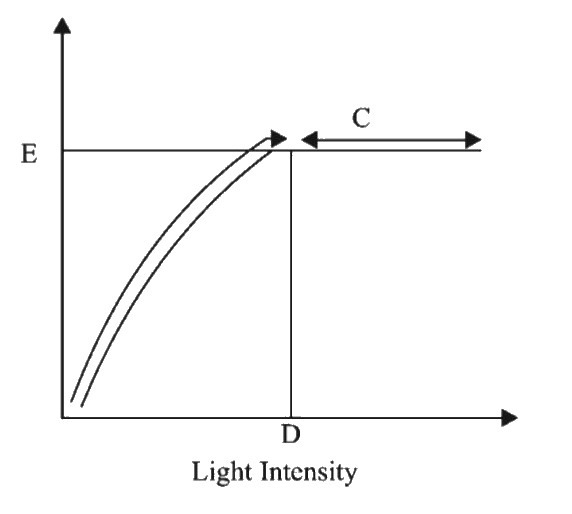
Figure given below shows the effect of light on the rate of photosynthesis. Based on the graph, answer the following questions

(a) At which point/s (A, B or C) in the curve is light a limiting factor?
(b) What could be the limiting factor/s in region A?
(c) What do C and D represent on the curve?
(a) B
(b) Carbon dioxide concentration and quantity of water may be limiting factor in region A.
(c) Crepresents that rate of photosynthesis fails to increase, even by increasing light intensity because some other factor like CO2 has become limiting. D is the light saturation point i.e., light intensity where the maximum amount of photosynthesis is achieved.
Topper's Solved these Questions
- BOOK - MODERN PUBLICATIONCHAPTER - PHOTOSYNTHESIS IN HIGHER PLANTSEXERCISE - NCERT FILE ( NCERT EXEMPLAR PROBLEMS ) (A. MULTIPLE CHOICE QUESTIONS )14videos
PHOTOSYNTHESIS IN HIGHER PLANTS
- BOOK - MODERN PUBLICATIONCHAPTER - PHOTOSYNTHESIS IN HIGHER PLANTSEXERCISE - NCERT FILE ( NCERT EXEMPLAR PROBLEMS ) (B. VERY SHORT ANSWER TYPE QUESTIONS )12videos
PHOTOSYNTHESIS IN HIGHER PLANTS
- BOOK - MODERN PUBLICATIONCHAPTER - PHOTOSYNTHESIS IN HIGHER PLANTSEXERCISE - PRACTICE PROBLEMS-PHOTOSYNTHESIS18videos
PHOTOSYNTHESIS IN HIGHER PLANTS
- BOOK - MODERN PUBLICATIONCHAPTER - NEURAL CONTROL AND COORDINATIONEXERCISE - Chapter Practice Test11videos
NEURAL CONTROL AND COORDINATION
- BOOK - MODERN PUBLICATIONCHAPTER - PLANT GROWTH AND DEVELOPMENTEXERCISE - CASE BASED SHORT ANSWER TYPE QUESTIONS1videos
PLANT GROWTH AND DEVELOPMENT
Similar Questions
Figure 13.10 shows the effect of light on the rate of photosynthesis. Based on the graph, answer the following questions:
(a) At which point/s (A, B or C) in the curve is light a limiting factor?
(b) What could be the limiting factor/s in region A?
(c) What do C and D represent on the curve?
 View Solution
Figure shows the effect of light on the rate of photosynthesis.
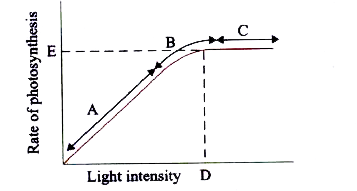
Based on the graph, answer the following questions.
At which point/s (A, B, or C) in the curve is light a limiting factor?View SolutionFigure shows, the effect of light on the rate of photosynthesis Based on the graph, answer the following questions.
a) At which points (A,B or C) in the curve is light a limiting factor?
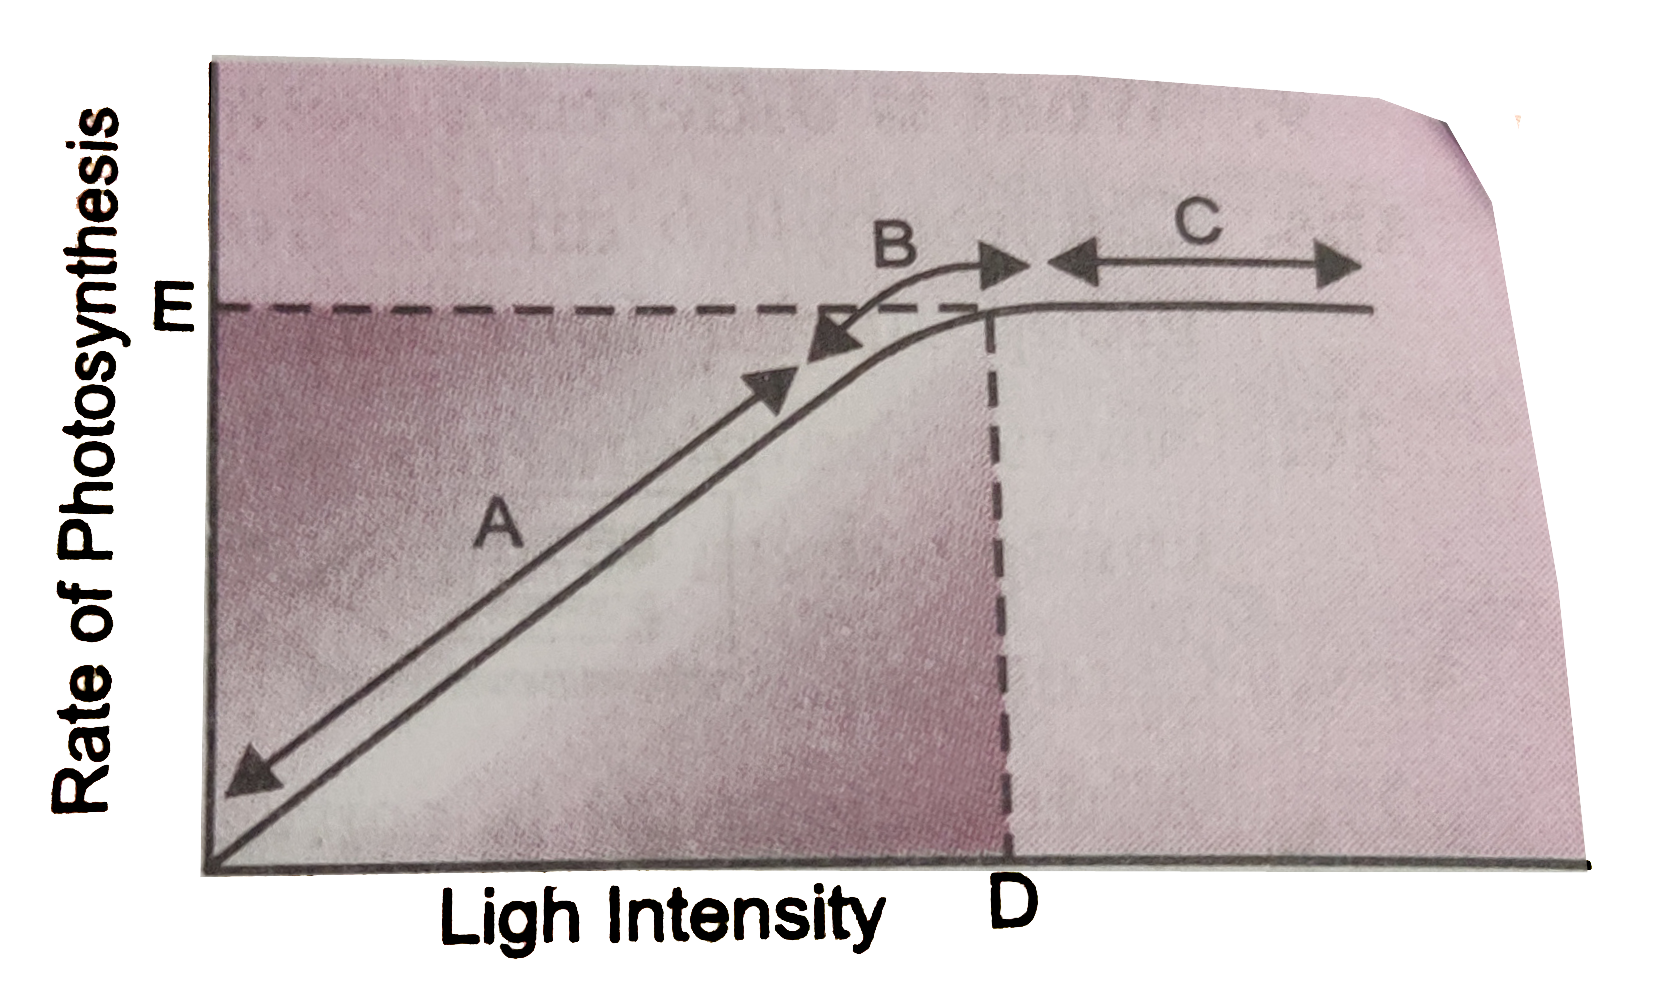
b) What could be the limiting factor/s in region A?
c) What do C and D represent on the curve?View SolutionThe figure shows the effect of light on the rate of photosynthesis. Based on the graph, answer the following questions :
What do region C and D represent on the curve ?
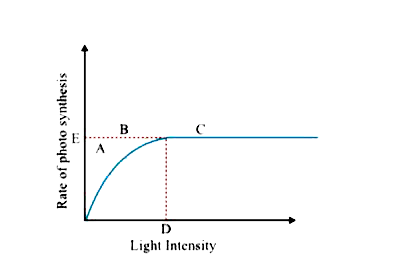 View Solution
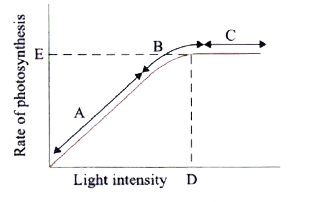
Figure shows the effect of light on the rate of photosynthesis.
Based on the graph, answer the following questions.
What do C and D represent on the curve?View SolutionFigure shows the effect of light on the rate of photosynthesis.
Based on the graph, answer the following questions.
What would be the limiting factors in region A?View SolutionThe figure shows the effect of light on the rate of photosynthesis. Based on the graph, answer the following questions :
What could be the limiting factor(s) in region A ?
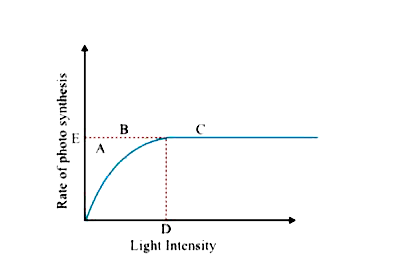 View Solution
Figure given below shows the effect of light on the role of photosynthesis. Based on graph
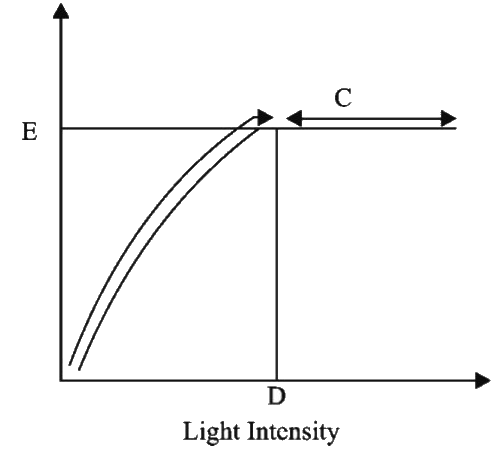
What could be the limiting factor/factors in region A?View SolutionFigure given below shows the effect of light on the role of photosynthesis. Based on graph
At which point/points (A,B or C) in the curve light is a limiting fac- tor?View SolutionBased on the below diagram, answer the following question.
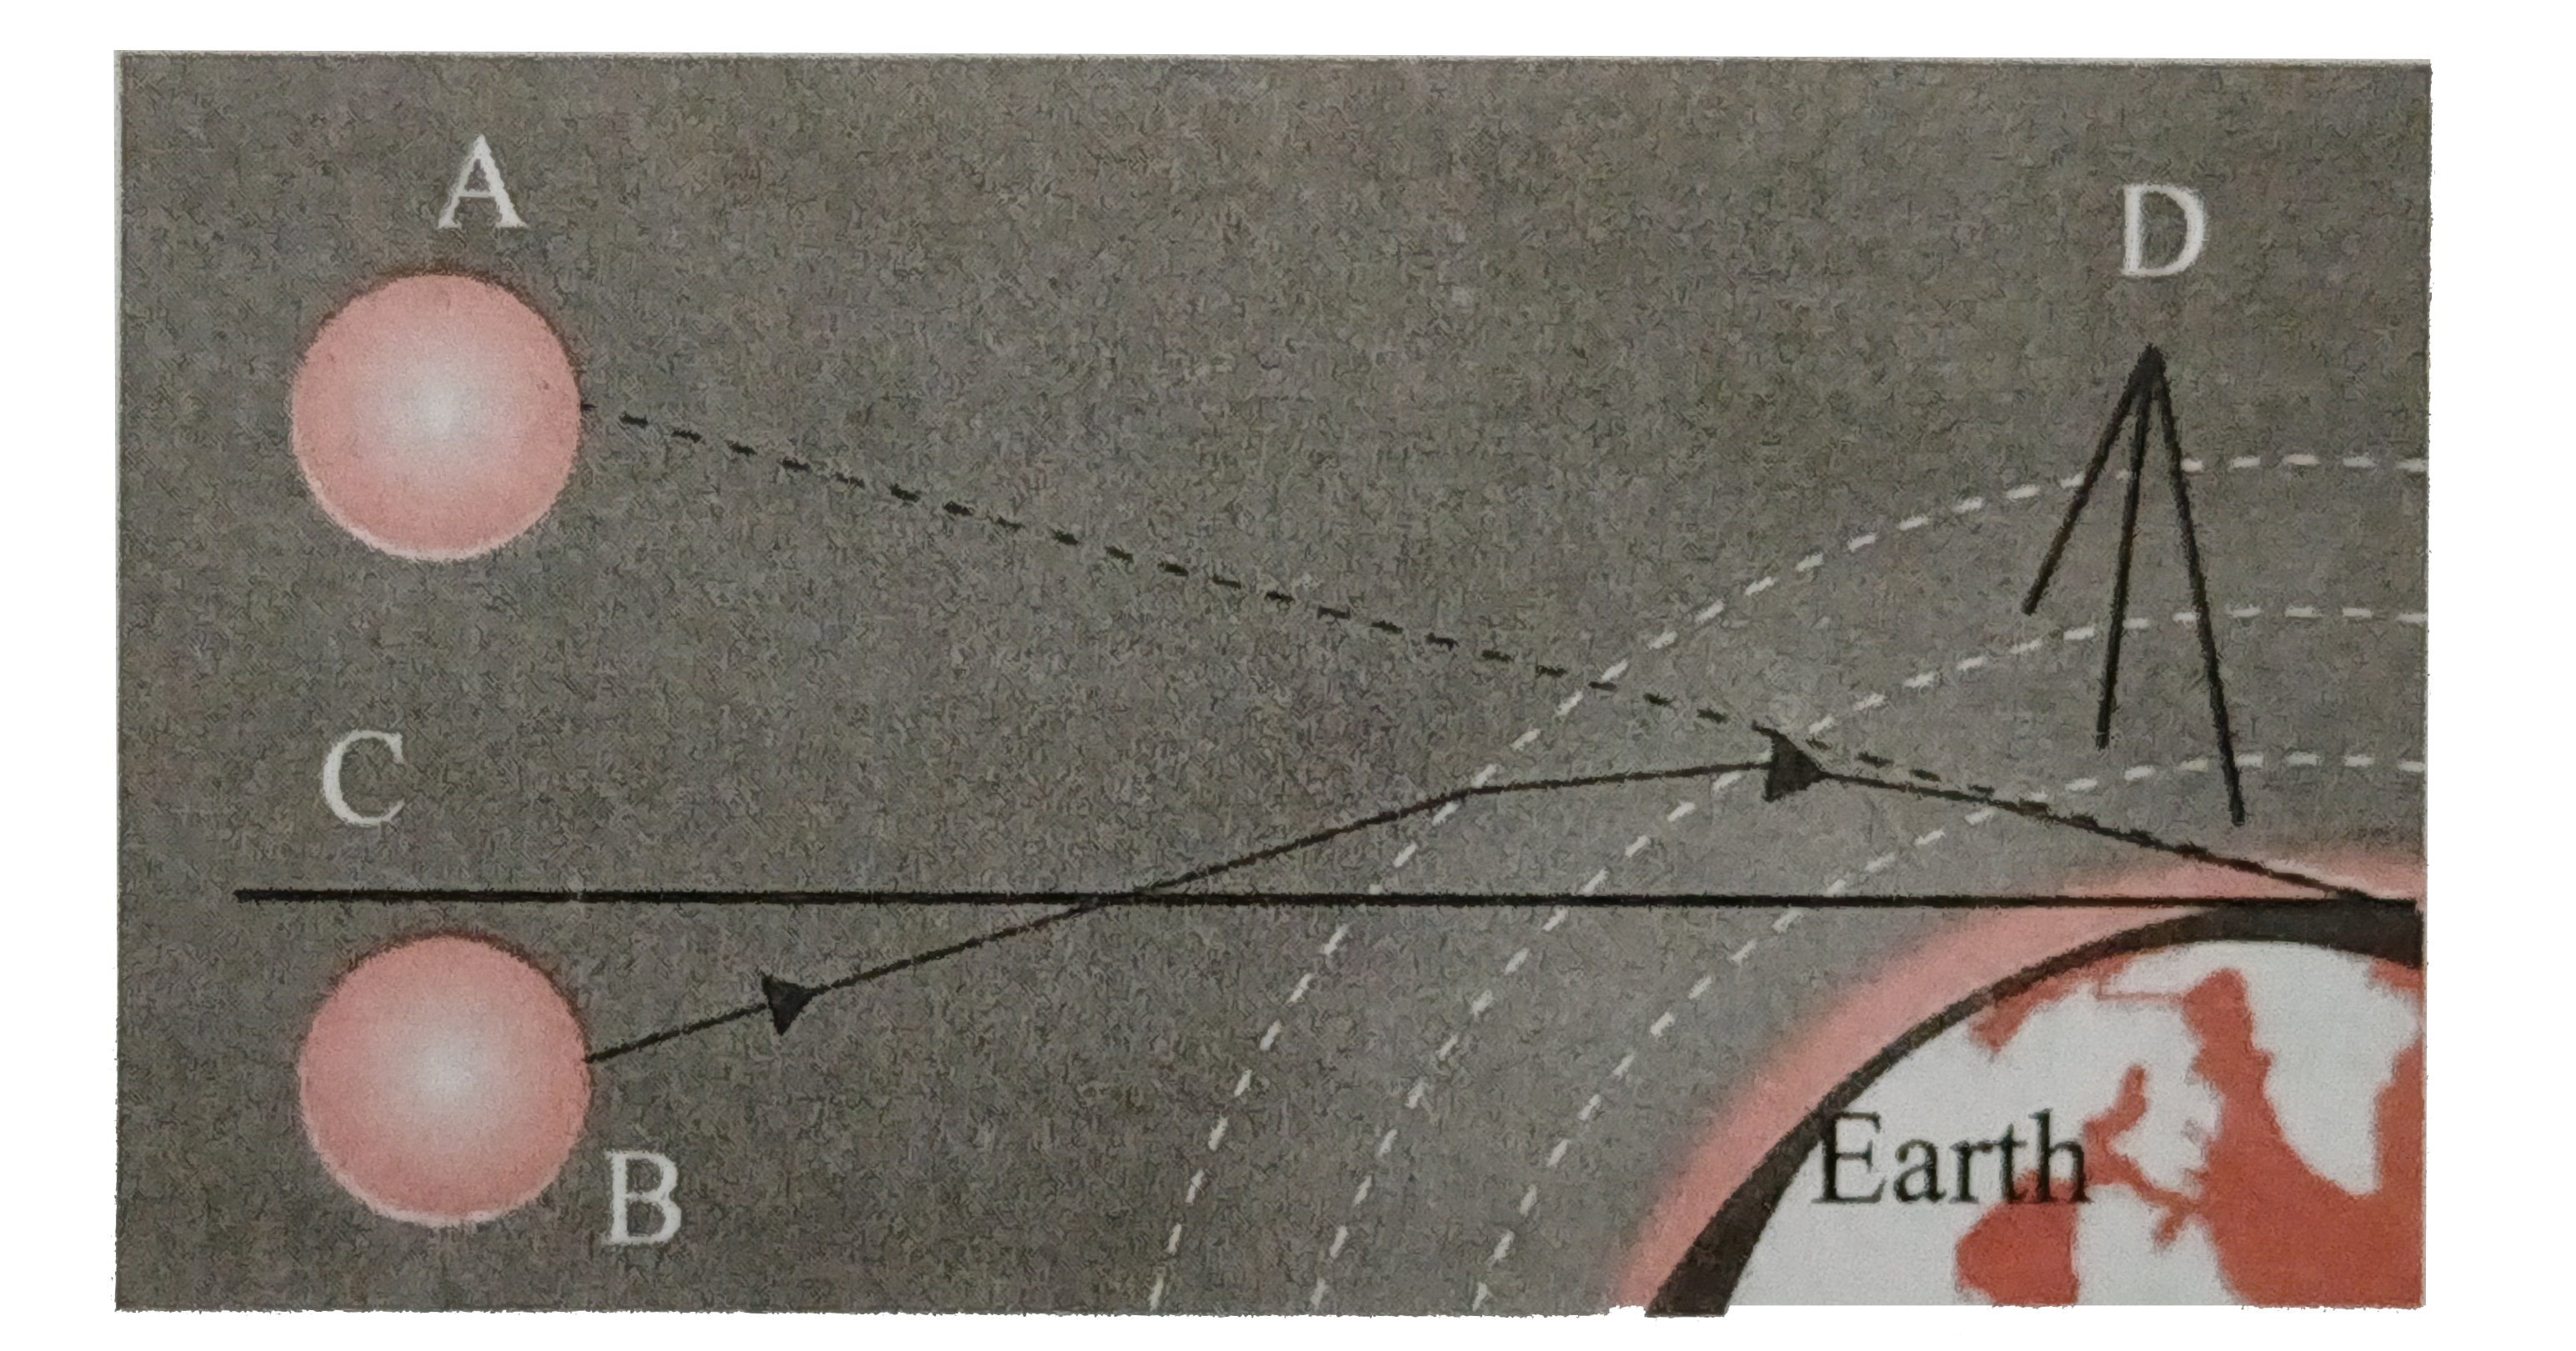
What do labels C and D denote?View Solution
