Given graph shows the growth of perromia plant.

a. What kind of growth form is this
b. Why does the graph show a sudden decline ?
Text Solution
a J- shaped growth form .
b J- shaped growth curve is obtained when the organism grows rapidly and then stops suddenly .As perperomia is a ephemeral it live below one year.
|
Topper's Solved these Questions
- ORGANISMS AND POPULATIONS BOOK - NEW JOYTHI PUBLICATIONCHAPTER - ORGANISMS AND POPULATIONS EXERCISE - Questin from Previous HSE
11 Videos
- ORGANISMS AND POPULATIONS BOOK - NEW JOYTHI PUBLICATIONCHAPTER - ORGANISMS AND POPULATIONS EXERCISE - Previous Entrance Exam Corner
27 Videos
- ORGANISMS AND POPULATIONS BOOK - NEW JOYTHI PUBLICATIONCHAPTER - ORGANISMS AND POPULATIONS EXERCISE - New Evaluation Types Question
27 Videos
- MOLECULAR BASIS OF INHERITANCEBOOK - NEW JOYTHI PUBLICATIONCHAPTER - MOLECULAR BASIS OF INHERITANCEEXERCISE - PREVIOUS YEAR COMPETITIVE EXAM QUESTIONS
72 Videos
- PRINCIPLES OF INHERITANCE AND VARIATION BOOK - NEW JOYTHI PUBLICATIONCHAPTER - PRINCIPLES OF INHERITANCE AND VARIATION EXERCISE - PREVIOUS YEAR COMPETITIVE EXAM QUESTIONS
72 Videos
Similar Questions
Knowledge Check
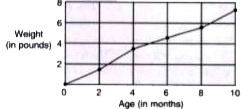
The given line graph shows the growth rate of a kitten . During which 2 - month period, the kitten's weight increased the most
 A0 to 2 monthsB2 to 4 monthsC4 to 6 monthsD6 to 8 months
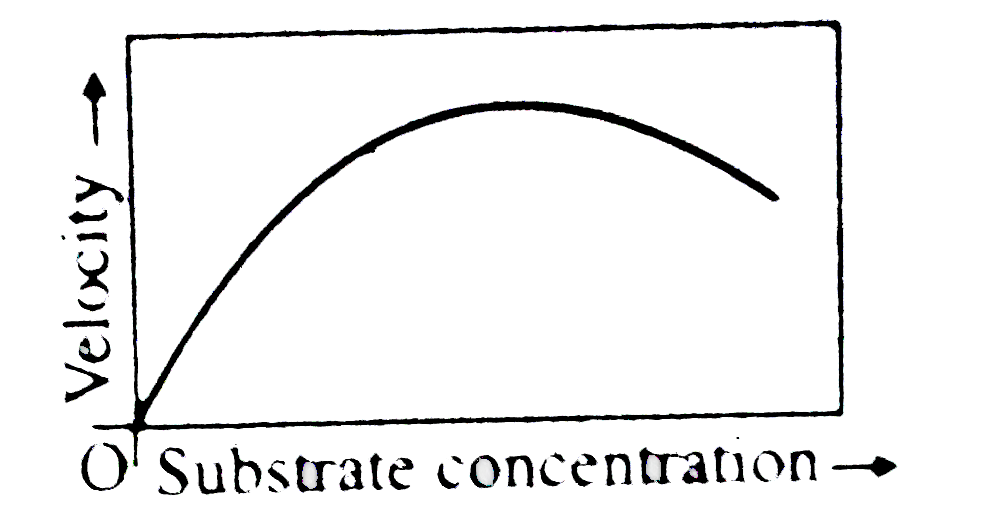
The given graph shows the effect of substrate concentration on the rate of reaction of the enzyme green-gram-phosphatase What does the graph indicate?
AThe rate of enzyme reaction is directly proportional to the substrate concentrationBPresence ofan enzyme inhibitor in the reaction mixtureCFormation of an enzyme-substrate complexDat higher substrate concentration the pH increases.The given graph shows the effect of substrate concentration on the rate of reaction of the enzymes green gram-phosphatase. What does the graph indicate ?
 AThe rate of enzyme reaction is directly proportional to the substrate concentration.BPressence of an enzyme inhibitor in the reaction mixture.CFormation of an enzyme-substrate complex.DAt higher substrate concentration the pH increase.
Plants show uniform growth.
View SolutionWhat kind of soil is most suitable for plant growth? Why?
View SolutionPlants showing no secondary growth are
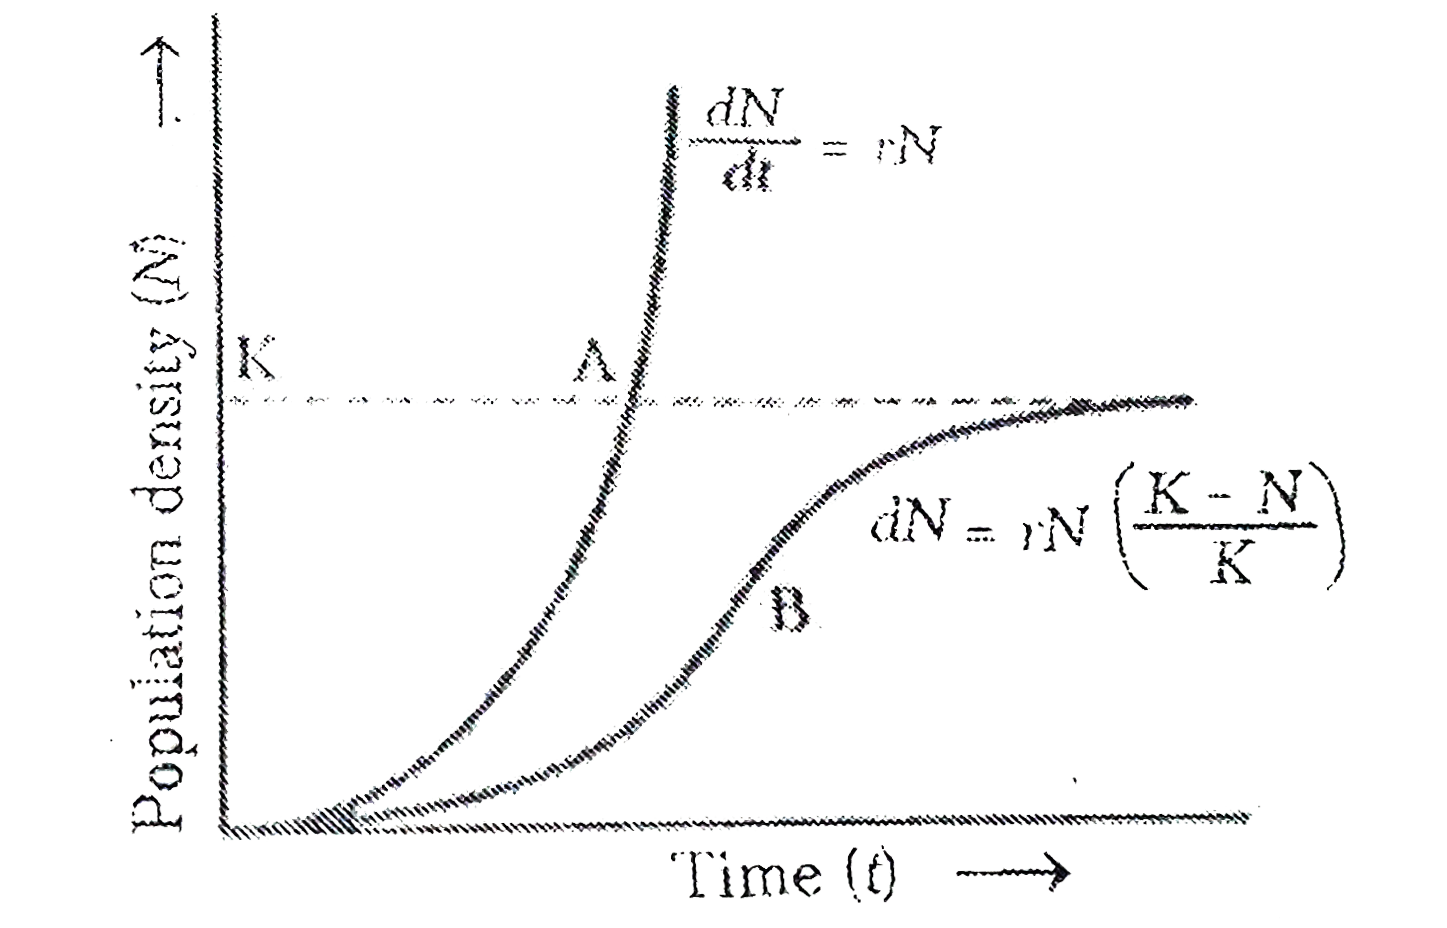
View SolutionThe graph shows two types of population growth curve A is exponential and B is logistic.

Which one of the following growth model considered as more realistic one?
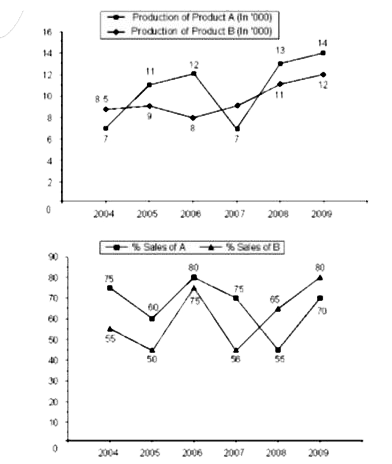
View SolutionThe line graph shows the production of product A and B during the period 2004 to 2009 and the second line graph shows the percentage sale of these products

In the given line graph, what is the total sale of products A and B in the year 2007
View Solution
