List any three important characteristics of a population and explain.
Step-by-Step Solution:
1. Understanding Population:
- A population is defined as a group of individuals of the same species that live in a specific geographical area for a certain period of time. For example, all the human beings residing in a particular city at a given time form a population.
2. Characteristic 1: Birth Rate:
- The birth rate is the ratio of live births in a specific area to the total population of that area. It indicates how many individuals are being added to the population over a certain period. A higher birth rate suggests a growing population, while a lower birth rate may indicate a declining population.
3. Characteristic 2: Death Rate:
- The death rate is the ratio of the number of deaths in a specific area to the total population of that area. This characteristic reflects the number of individuals lost from the population over a certain period. A high death rate can lead to a decrease in the population size, while a low death rate suggests a stable or growing population.
4. Characteristic 3: Age Distribution:
- Age distribution refers to the percentage of individuals of different ages within a population. It provides insight into the demographic structure of the population and can be represented using an age pyramid. Understanding age distribution is crucial for predicting future population trends, such as growth or decline, and for planning resources accordingly.
Summary of Characteristics:
- Birth Rate: Indicates population growth through the number of live births.
- Death Rate: Reflects population decline through the number of deaths.
- Age Distribution: Shows the demographic structure and helps in understanding future population trends.
---
- A population is defined as a group of individuals of the same species that live in a specific geographical area for a certain period of time. For example, all the human beings residing in a particular city at a given time form a population.
- The birth rate is the ratio of live births in a specific area to the total population of that area. It indicates how many individuals are being added to the population over a certain period. A higher birth rate suggests a growing population, while a lower birth rate may indicate a declining population.
- The death rate is the ratio of the number of deaths in a specific area to the total population of that area. This characteristic reflects the number of individuals lost from the population over a certain period. A high death rate can lead to a decrease in the population size, while a low death rate suggests a stable or growing population.
- Age distribution refers to the percentage of individuals of different ages within a population. It provides insight into the demographic structure of the population and can be represented using an age pyramid. Understanding age distribution is crucial for predicting future population trends, such as growth or decline, and for planning resources accordingly.
- Birth Rate: Indicates population growth through the number of live births.
- Death Rate: Reflects population decline through the number of deaths.
- Age Distribution: Shows the demographic structure and helps in understanding future population trends.
Topper's Solved these Questions
Similar Questions
Knowledge Check
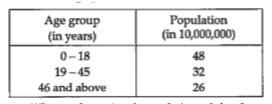
Age-gender structure is one of the most important characteristics of population composition. Almost all population characteristics vary significantly with age. Age statistics form an important component of population analysis. The usefulness of age data is more noticeable when it is cross classified by variables like marital status, literacy, economic activity which vary with age in different patterns.
Suppose census report the population (approx.) of different age groups in the year 2020.
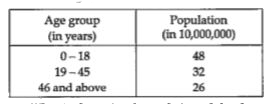
What is the ratio of population of the three age groups ?A24:16:13B13:16:24C16:24:13D13:24:16Age-gender structure is one of the most important characteristics of population composition. Almost all population characteristics vary significantly with age. Age statistics form an important component of population analysis. The usefulness of age data is more noticeable when it is cross classified by variables like marital status, literacy, economic activity which vary with age in different patterns.
Suppose census report the population (approx.) of different age groups in the year 2020.
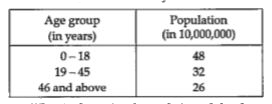
If y is the mean population to 48 and 36, then the value of y is :A42B24C6D12Age-gender structure is one of the most important characteristics of population composition. Almost all population characteristics vary significantly with age. Age statistics form an important component of population analysis. The usefulness of age data is more noticeable when it is cross classified by variables like marital status, literacy, economic activity which vary with age in different patterns.
Suppose census report the population (approx.) of different age groups in the year 2020.
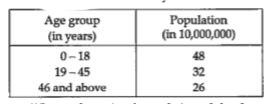
If r is the fourth proportional of the numbers of the ratio, obtained in (i), then the value of xA245B292C263D394
Write an important characteristic of lyophilic sols.
View SolutionNatality is the characteristic of population which means :
View SolutionDescribe the important characteristics of gymnosperms.
View SolutionAge-gender structure is one of the most important characteristics of population composition. Almost all population characteristics vary significantly with age. Age statistics form an important component of population analysis. The usefulness of age data is more noticeable when it is cross classified by variables like marital status, literacy, economic activity which vary with age in different patterns.
Suppose census report the population (approx.) of different age groups in the year 2020.
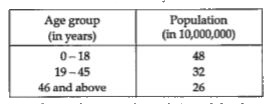
If z is the third proportion to 9 and 15, then the value of z is
View SolutionAge-gender structure is one of the most important characteristics of population composition. Almost all population characteristics vary significantly with age. Age statistics form an important component of population analysis. The usefulness of age data is more noticeable when it is cross classified by variables like marital status, literacy, economic activity which vary with age in different patterns.
Suppose census report the population (approx.) of different age groups in the year 2020.
The compounded ratio of 3 : 8 and 4 : 9 is
View Solution
